
Wendy’s pricing power is real but narrowing, constrained less by consumer resistance than by franchisee economics that cannot absorb higher menu prices without losing traffic.
TL;DR:
- Wendy’s margins have compressed by nearly 4 percentage points in Q1 2026, indicating that cost inflation and traffic softness are outpacing price increases.
- The franchise fee structure results in an effective fee burden close to 8% of gross sales, which limits how much franchisees can support price hikes.
- Input costs like beef and labor remain volatile, and AI-driven throughput improvements from FreshAI help protect margins without solely relying on price increases.
- Systemwide sales declined about 5.5%, with traffic decline mainly affecting U.S. same-restaurant sales, constraining long-term pricing power.
- Regional price variation and franchisee health signals, such as rising bad debts, are key indicators of when Wendy’s pricing power may weaken further.
Table of Contents
- Wendy’s Pricing Power by the Numbers: Margins, Sales, and Fees
- What Actually Supports Wendy’s Ability to Raise Prices
- Why the Franchise Model Limits Unilateral Price Moves
- When Wendy’s Pricing Power Breaks Down
- Modeling Wendy’s Pricing Power Into a Valuation
- How Input Cost Inflation Shapes Wendy’s Pricing Decisions
- Consumer Price Sensitivity: How Elastic Is Wendy’s Demand?
- Promotional Pricing and Its Real Effect on Volume
- Do Menu Prices Vary by Region, and Does It Matter?
- Is Wendy’s Brand Premium Durable Over the Long Term?
- BuyWendy’s Analyst Take: What We Track and Why It Matters
- Get the Full Wendy’s Pricing Power Model
- Sources
Wendy’s Pricing Power by the Numbers: Margins, Sales, and Fees
Anyone modeling Wendy’s has to start with four figures, because they define the ceiling and floor of every pricing scenario.
In Q1 2026, that band broke down, with margin compressing by about 3.9 percentage points. That is not a rounding error. It is the clearest signal that cost inflation and traffic softness are outrunning whatever price increases Wendy’s has already pushed through.
Sales tell a parallel story. Global systemwide sales fell approximately 5.5% in the same reporting period, driven largely by weaker U.S. same-restaurant sales, and adjusted EBITDA and net income declined alongside it.
The franchise fee structure is the mechanical piece that ties corporate performance directly to franchisee results:
- Royalty rate: 4.0% of gross sales, collected regardless of unit-level profitability
- Advertising fund contribution: approximately 4.0%, layered on top of the royalty
- Median AUV: roughly $2.1 million per franchise-cost data, with a $50,000 initial franchise fee
- Effective fee burden: close to 8% of gross sales, before any local rent or lease obligations
What Actually Supports Wendy’s Ability to Raise Prices
Wendy’s pricing power does not come from menu boards alone. It comes from a mix of product positioning, a royalty structure that scales with sales, and technology that changes the cost side of the equation without touching price at all.
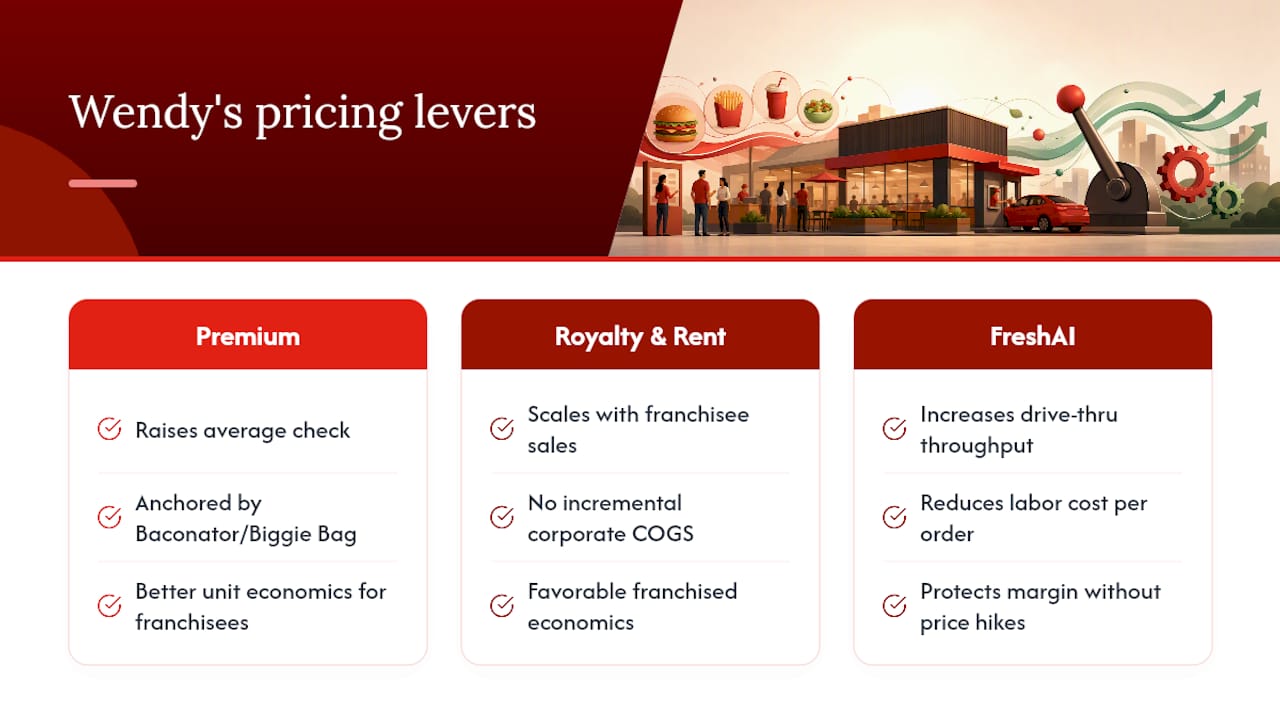
The premium-value strategy, anchored by items like the Baconator and the Biggie Bag platform, gives Wendy’s room to push average check higher without abandoning the value perception that keeps traffic flowing. Higher-check items carry better unit economics for franchisees, which matters because franchisee willingness to support a price increase is the actual constraint, not corporate intent.
Royalty and rent revenue is the second lever, and it is a genuinely favorable one. There is no incremental cost of goods on the corporate side. That is a structurally different economic engine than a company-operated restaurant chain, and it is the reason franchised systems trade at premium multiples when same-restaurant sales are healthy.
FreshAI and related digital investments are the third lever, and arguably the most underappreciated one. FreshAI’s drive-thru deployment is designed to raise throughput and reduce labor cost per order, which means Wendy’s can protect margin without asking franchisees to accept a price increase they might not be able to sell to price-sensitive customers.
Pro Tip: Model FreshAI’s margin contribution separately from price increases in your spreadsheet. Throughput gains and price gains hit the income statement through different channels, and conflating them overstates how much “pricing power” is actually organic.
Scale matters too. A system with a median AUV near $2.1 million has more room to test premium items in high-volume units before rolling them systemwide, which reduces the risk of a bad pricing decision cascading across thousands of franchise locations at once.
Why the Franchise Model Limits Unilateral Price Moves
Wendy’s cannot simply raise prices the way a company-owned retailer can, because it does not set prices at the register. Franchisees do. That single structural fact is the most important thing an investor can internalize about Wendy’s pricing strategy.
The fee burden is the starting point. Franchisees pay a 4.0% royalty plus roughly 4.0% into the advertising fund, an effective drag near 8% of gross sales before rent, labor, and food costs. On a median AUV of about $2.1 million, that fee burden totals close to $168,000 a year, off the top, before a franchisee covers a single input cost.
Typical franchisee owner earnings run in the neighborhood of $220,000 annually system-wide, though that figure masks enormous variance. FDD Item 19 dispersion data shows top-quartile units generating AUV near $2.7 million while bottom-quartile units sit closer to $1.5 million. A price increase that helps a top-quartile operator can push a bottom-quartile operator toward closure.
| Franchise metric | Approximate value |
|---|---|
| Median AUV | $2.1 million |
| Top-quartile AUV | $2.7 million |
| Bottom-quartile AUV | $1.5 million |
| Royalty rate | 4.0% of gross sales |
| Advertising fund contribution | ~4.0% of gross sales |
| Initial franchise fee | $50,000 |
Wendy’s also cannot force capital-intensive remodels or equipment upgrades without franchisee buy-in, since franchisees fund most of that capex themselves. When franchisee-level stress rises, whether through closures or bad-debt provisions on corporate loans to operators, the royalty base itself shrinks. That feedback loop is why refranchising economics and franchisee liquidity deserve as much attention as headline menu prices.
When Wendy’s Pricing Power Breaks Down
Pricing power sounds durable in a slide deck. It behaves differently when traffic is falling for multiple consecutive quarters, which is the situation Wendy’s has been navigating.
- Traffic elasticity is already showing up in the numbers. Systemwide sales fell about 5.5% in Q1 2026, and higher average checks have only partially offset weaker visit counts, a pattern documented across multiple recent quarters of softer same-restaurant sales.
- Competitor discounting blunts premium positioning. When rivals run aggressive value promotions, Wendy’s premium menu items lose some of their relative pricing appeal, forcing a choice between margin and volume.
- Balance-sheet capacity to force a fix is limited. Wendy’s halved its dividend and withdrew guidance, a clear signal that corporate capital available to subsidize franchisee remodels or absorb short-term margin pain is constrained.
- Franchisee cash-flow stress is the leading indicator, not the lagging one. Rising bad-debt provisions and unit closures reduce the royalty base directly, meaning pricing power erodes from the bottom of the system upward before it shows up in corporate guidance.
Statistic to watch: a dividend cut alongside withdrawn guidance is a stronger signal of constrained pricing power than any single quarter’s same-restaurant sales figure, because it reflects management’s own read on near-term cash generation.
Modeling Wendy’s Pricing Power Into a Valuation
Treat price and traffic as two separate levers, not one blended assumption. Royalty revenue is proportional to average check multiplied by transaction count, so a sensitivity table needs independent rows for each, not a single “same-restaurant sales” line.
Stress-test these four line items specifically:
- Royalty growth, split into price contribution versus transaction contribution
- Same-restaurant sales, U.S. and international separately
- Adjusted EBITDA and free cash flow, cross-checked against quarterly earnings breakdowns
- Dividend sustainability, given the recent cut and withdrawn guidance
Three scenario buckets keep the model honest:
| Scenario | Price assumption | Traffic assumption | Margin outcome |
|---|---|---|---|
| Conservative | Flat to modest price increases | Continued traffic decline | Margin stays below the historical band |
| Base | Selective premium menu pricing | Traffic stabilizes near flat | Margin partially recovers toward the low end of the historical band |
| Upside | Price increases hold with FreshAI throughput gains | Traffic modestly improves | Margin approaches the historical band’s midpoint |
Watch same-restaurant sales, gross margin, and franchisee bad-debt provisions every quarter. Any two of the three moving in the wrong direction simultaneously should trigger a model revision, not just a note in the file.
How Input Cost Inflation Shapes Wendy’s Pricing Decisions
Beef, bun, and labor costs move independently of consumer demand, and Wendy’s has limited ability to pass through every dollar of input inflation without risking traffic. When commodity costs spike faster than management can justify a menu price increase to a value-conscious customer base, gross margin absorbs the difference. That is exactly what shows up in the recent 3.9 percentage point margin decline.
Labor cost is arguably the more persistent input pressure, since minimum wage increases across various states compound over time in ways beef futures do not always mirror. Franchisees feel this first, because they run the restaurants and pay the crews. Corporate feels it second, through slower royalty growth as franchisees hesitate to raise prices aggressively enough to offset their own cost increases.
This is where FreshAI’s throughput argument becomes a genuine input-cost hedge rather than a customer-experience talking point. If AI-assisted drive-thru ordering reduces labor hours per transaction, franchisees can partially offset wage inflation without needing a price increase at all. That decouples margin protection from pricing decisions, which is a healthier setup for long-term pricing power than relying on price increases alone.
Investors should treat input cost inflation as a variable that competes directly with pricing power rather than one that simply justifies it. A menu price increase that merely keeps pace with commodity and labor inflation adds no real pricing power. Genuine pricing power shows up only when price increases outrun input cost growth and margin actually expands, which has not been the recent pattern.
Consumer Price Sensitivity: How Elastic Is Wendy’s Demand?
Fast food demand is not uniformly elastic, and Wendy’s specific customer base skews more price-sensitive than premium casual dining but less sensitive than deep-discount value chains. That middle position is precisely why pricing decisions carry outsized risk. Push too hard and customers trade down to value menus or competitor promotions. Hold prices flat and margin absorbs every input cost increase.
The clearest evidence of demand elasticity showing up in the numbers is the gap between average check growth and transaction growth. When average check rises while transactions fall at a similar or steeper rate, that is a textbook elasticity signal: customers are visiting less often even as they spend more per visit. Recent quarters have shown exactly that pattern, with higher checks only partially offsetting traffic softness rather than fully compensating for it.
Breakfast, lunch, and late-night dayparts likely carry different elasticity profiles, though Wendy’s does not break out pricing sensitivity by daypart in public disclosures. What is observable is aggregate: multiple consecutive quarters of same-restaurant sales pressure suggest the price increases already implemented have pushed close to, or past, the point where volume loss offsets the revenue gain.
Investors modeling elasticity should avoid assuming a single number applies system-wide. A franchisee in a high-income suburban market likely tolerates a price increase far better than one in a lower-income market competing directly against dollar-menu promotions from rivals. That dispersion is invisible in headline same-restaurant sales figures but shows up eventually in franchisee closures and bad-debt provisions.
Promotional Pricing and Its Real Effect on Volume
Promotional pricing is the lever Wendy’s pulls when organic traffic softens, and it works, but it works by trading margin for volume rather than growing both simultaneously. Limited-time value bundles and digital-app-exclusive deals drive short-term transaction counts higher, which helps royalty revenue in the quarter they run, but they also compress average check and gross margin at the same time.
The strategic tension is straightforward: heavy reliance on promotional pricing signals that base-menu pricing power alone is not generating enough traffic. Wendy’s competitive positioning against value-focused promotional cycles from other quick-service chains means it cannot simply hold premium pricing and wait out a traffic downturn. It has to periodically discount to defend transaction volume, which is a tacit admission that full pricing power does not currently exist across the whole menu.
Digital and loyalty-app promotions carry one advantage over blanket discounting: they can be targeted rather than system-wide, preserving margin on full-price transactions while still driving incremental visits from price-sensitive segments. That targeting capability, enabled by the same digital infrastructure supporting FreshAI, is a more sustainable promotional tool than the blunt value-menu wars that defined the category for a decade.
Investors should watch whether promotional intensity is rising or falling quarter over quarter. Rising promotional dependence alongside declining same-restaurant sales is a warning sign that pricing power is deteriorating faster than management commentary suggests, regardless of what the headline average-check figure shows.
Do Menu Prices Vary by Region, and Does It Matter?
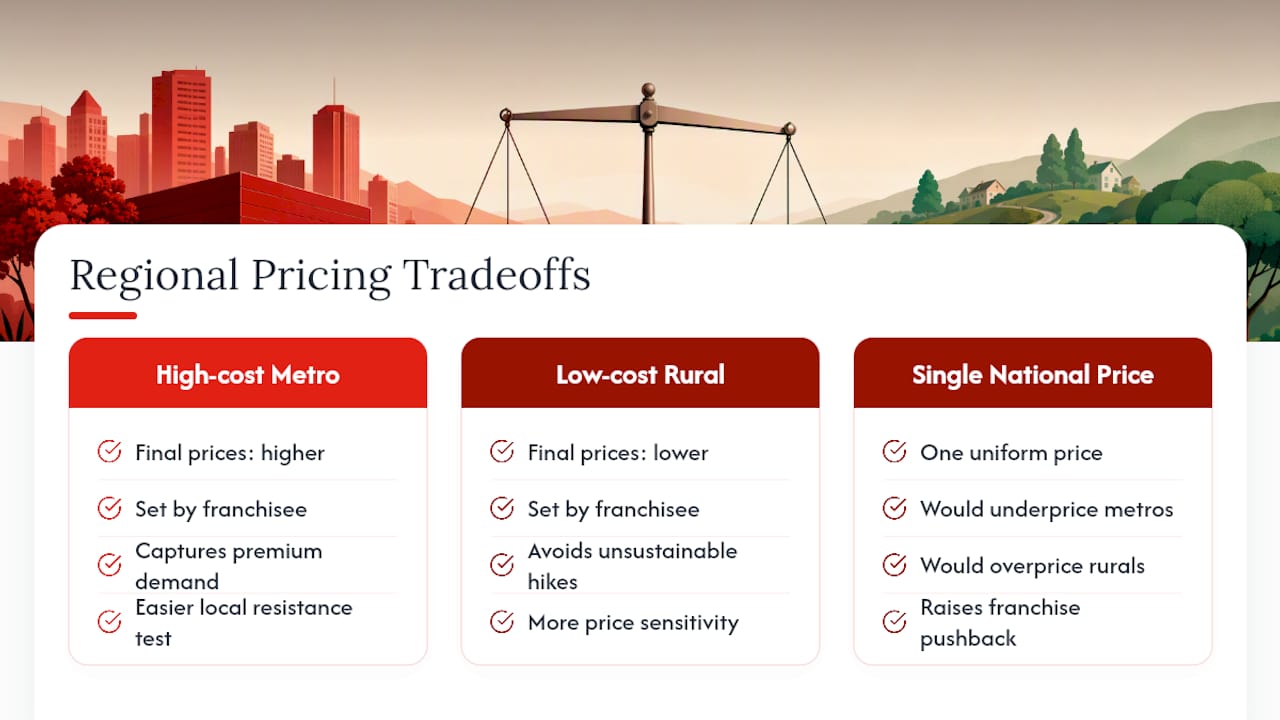
Menu prices at Wendy’s are not uniform across the country, and that variation is a deliberate function of franchise structure rather than an oversight. Individual franchisees set final register prices within a general corporate framework, adjusting for local labor costs, rent, and competitive intensity. A Wendy’s in a high-cost metro market will typically post higher prices than one in a lower-cost rural market, even for an identical Baconator.
This geographic flexibility is actually a hidden strength for systemwide pricing power, because it lets the brand capture premium pricing where the local market supports it without forcing an unsustainable price increase on franchisees operating in cost-constrained regions. A single national price point would either underprice high-cost markets or overprice low-cost ones. Franchise-level pricing autonomy avoids both problems.
The downside for investors is that this same flexibility makes systemwide pricing power harder to measure precisely. Corporate disclosures report blended same-restaurant sales and average check figures, not a regional breakdown. An investor cannot easily tell whether reported average-check growth is concentrated in a handful of high-income markets or distributed evenly across the system, and that distinction matters enormously for judging how much further price increases can realistically go before hitting resistance in weaker markets.
International markets add another layer of segmentation, with different competitive sets, currency effects, and consumer price sensitivity than the U.S. system. Systemwide sales figures blend domestic and international performance, so a investor modeling pricing power should treat U.S. same-restaurant sales as the more reliable near-term signal.
Is Wendy’s Brand Premium Durable Over the Long Term?
Long-term pricing power depends on whether Wendy’s brand equity can support price increases faster than input cost inflation over multiple years, not just survive a single quarter of margin pressure. The evidence so far is mixed rather than conclusively positive or negative.
The favorable case rests on the royalty-based revenue model itself. Even in a margin-compressed environment, Wendy’s corporate revenue benefits from any price-driven sales growth at close to full margin, because royalties are collected on top-line franchisee sales, not on franchisee profitability. That structural advantage does not disappear even when unit economics are stressed. It simply means the size of the benefit shrinks when traffic weakens alongside price increases, as it has recently.
The unfavorable case rests on the franchisee health signal. A brand’s long-term pricing power is only as durable as the operators executing it at the register, and rising bad-debt provisions plus unit closures indicate that some portion of the franchise base is struggling to absorb current cost pressure, let alone support future price increases. Refranchising activity and franchisee liquidity are the metrics that will reveal whether this is a temporary cyclical dip or a structural erosion of brand premium.
FreshAI and digital ordering infrastructure represent the best long-term argument for sustained pricing power, because they attack the cost side of the equation rather than asking customers to simply pay more. A brand that can protect margin through throughput and efficiency gains needs less aggressive pricing to hit the same EBITDA target, which is a more durable path than relying on price increases the market may eventually reject.
BuyWendy’s Analyst Take: What We Track and Why It Matters
Pricing power headlines almost always cite average check growth and ignore the franchisee balance sheet underneath it. That is backwards. Buywendys builds its models around franchisee-level dispersion, because a median AUV figure hides exactly the operators who would break first under a poorly timed price increase.
The methodology leans on FDD Item 19 quartile data, quarterly earnings reconciliations, and FreshAI throughput research rather than headline same-restaurant sales alone. Readers can dig deeper through the menu pricing guide and the FreshAI operational analysis, both of which feed directly into the scenario framework described above.
— Benjamin
Get the Full Wendy’s Pricing Power Model
The scenario table above gives you the framework. What it does not give you is the row-by-row detail: quarterly royalty splits, franchisee quartile AUV updates, and the exact sensitivity inputs analysts use to stress-test dividend sustainability against margin recovery.
That level of detail is what a Buywendys subscription is built for. Subscribers get detailed earnings breakdowns reconciled against GAAP disclosures, menu-pricing elasticity models tied to FreshAI throughput data, and custom scenario inputs you can plug straight into your own valuation work instead of rebuilding a spreadsheet from scratch every quarter. It is not a signal service and it is not investment advice. It is the modeling infrastructure for readers who want repeatable, comparable data every earnings cycle rather than a one-time estimate.
If you want a structured starting point, the stock valuation and analysis toolkit walks through the exact framework referenced in this article, with templates you can adapt to your own assumptions. Check it out before Wendy’s next earnings release resets the numbers again.
Sources
Every figure in this article traces back to a primary filing or disclosure. Building your own model starts with the same documents.
- THE WENDY’S COMPANY reports first quarter 2026 results
- The Wendy’s Company reports first quarter 2026 results (PR Newswire)
- Wendy’s franchise cost & profit 2026 (FDD data)
- Wendy King Passed Wendy’s. Wendy’s turnaround money works out to $9,300 a restaurant
This article is general information, not a substitute for advice from a qualified financial advisor. Consult a qualified financial professional about your own circumstances before acting on anything here.