
Table of Contents
- Executive Summary: The Valuation Gap in Retail Investing
- Why Raw Stock Data Falls Short of Professional Financial Analysis
- Best Stock Analysis Tools for Retail Investors
- Fundamental Analysis of QSR Stocks: What Separates Data from Insight
- How to Interpret Restaurant Franchise Financial Statements
- Data Quality vs. Data Quantity: What Actually Moves Valuation
- Practical Workflow Integration: From Raw Data to Investment Thesis
- Key Takeaways
Last Updated: August 7, 2026
Executive Summary: The Valuation Gap in Retail Investing
The gap between raw stock data and professional-grade financial analysis represents one of the largest barriers to informed decision-making for individual investors. While data itself has become democratized, free stock quotes, earnings transcripts, and SEC filings are accessible to anyone with an internet connection, the ability to interpret that data with institutional rigor remains concentrated among professionals with expensive tools and years of training.
This distinction matters most for complex stocks like restaurant franchisors, where capital allocation, franchise economics, and technology adoption create multiple valuation scenarios. A retail investor armed with a Bloomberg Terminal still wouldn’t outperform one with a clear framework for interpreting what the data actually means. The real competitive advantage lies not in access to information, but in the ability to synthesize it into actionable insight.
Buy Wendy’s exists to bridge this gap specifically for investors analyzing The Wendy’s Company (NASDAQ: WEN). Rather than competing on data breadth, where institutional platforms will always win, the platform focuses on translating complex financial data into frameworks that individual investors can actually use. This approach recognizes a fundamental truth: stock valuation analysis requires both data AND interpretation, and most retail investors have the former but lack the latter.
Why Raw Stock Data Falls Short of Professional Financial Analysis
Raw data tells you what happened. It doesn’t tell you what it means.
Consider a Wendy’s earnings report showing same-store sales growth of 2.1%. A retail investor sees the number. A professional analyst sees context: Is this growth accelerating or decelerating? How does it compare to historical trends? What drove it, pricing, traffic, or menu mix? Is it sustainable given competitive pressures and consumer spending patterns? The raw number is identical, but the interpretation diverges dramatically.
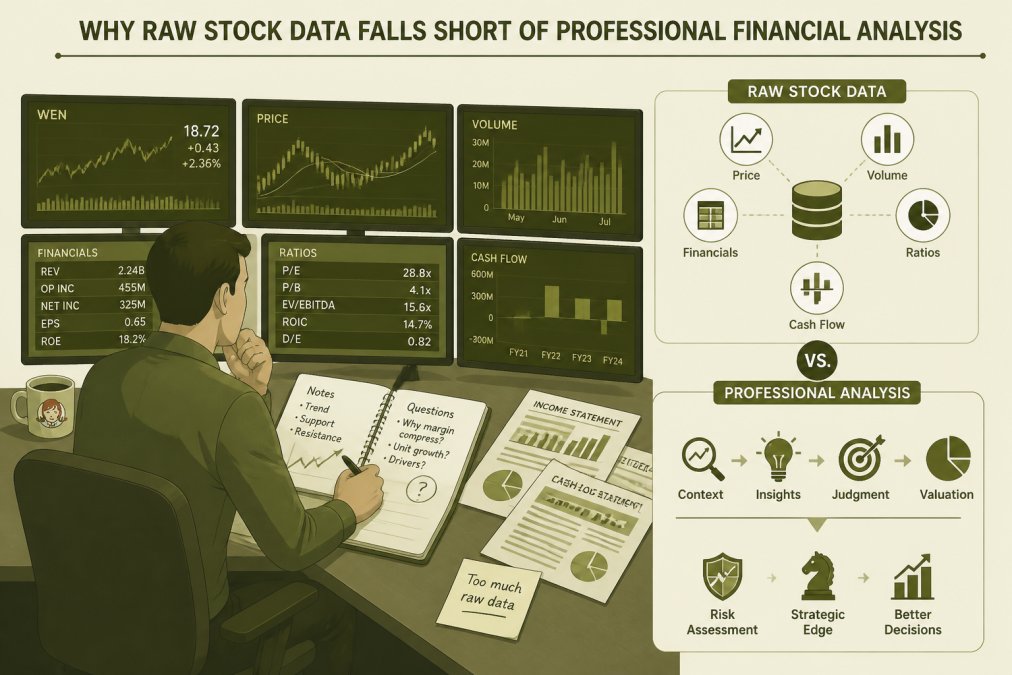
Professional financial analysis platforms like Bloomberg Terminal and Capital IQ provide institutional-grade data aggregation, but they assume the user already knows how to interpret it. They’re designed for analysts who spend eight hours daily reading financial statements, not for individual investors managing a portfolio on nights and weekends.
The core limitation isn’t data availability, it’s interpretive framework. Restaurant franchise stocks present specific valuation challenges that generic stock screeners don’t address. Unit economics, franchise royalty structures, capital intensity, and same-store sales trends interact in ways that require domain expertise to model correctly. A tool that flags "low P/E ratio" misses entirely whether that valuation reflects genuine undervaluation or a structural decline in franchise economics.
Additionally, institutional analysis incorporates proprietary research, management relationships, and forward guidance that never appears in public filings. Individual investors cannot replicate this advantage. What they can do is build systematic frameworks for extracting maximum insight from publicly available information, and that’s where professional-level analysis becomes accessible without the professional-level price tag.
Best Stock Analysis Tools for Retail Investors
The market for retail stock analysis has fragmented into three distinct tiers, each serving different investor profiles and analytical needs.
Institutional-Grade Platforms vs. Consumer Tools
Institutional platforms dominate on breadth and real-time data. Bloomberg Terminal remains the gold standard for comprehensive market coverage, offering real-time pricing across equities, fixed income, commodities, and derivatives alongside proprietary Bloomberg News and advanced analytics. However, at approximately $31,980 annually with a two-year contract requirement, it’s priced for institutions and professional traders, not individual investors.
S&P Capital IQ Pro and FactSet occupy similar territory, comprehensive coverage of both public and private companies with extensive financial modeling capabilities. Both require direct contact for pricing, typically reflecting enterprise-level costs that exceed most retail investor budgets. These platforms excel at depth but assume professional expertise in interpretation.
Consumer-focused platforms take a different approach. Morningstar Investor provides independent analyst research, proprietary fair value estimates, and portfolio analysis tools starting at $249 annually. The platform translates complex financial data into actionable ratings (star ratings for funds, economic moat assessments, stewardship ratings for stocks) that individual investors can understand without a finance degree. The tradeoff: less granular data than institutional platforms, but more interpretive guidance.
Buy Wendy’s operates at the intersection of these approaches, providing institutional-quality analysis specifically tailored to a single stock. Rather than attempting to compete with Bloomberg’s data breadth, it focuses on depth within a specific domain. The platform synthesizes earnings analysis, franchise economics, technology adoption metrics, and dividend sustainability into frameworks that translate raw data into investment theses. For investors specifically interested in The Wendy’s Company, this specialization delivers more actionable insight than a generic platform covering 10,000 stocks.
| Platform | Primary Use | Best For | Key Limitation |
|---|---|---|---|
| Bloomberg Terminal | Real-time institutional data | Professional traders, investment banks | Cost ($31,980/year) limits retail access |
| S&P Capital IQ Pro | Fundamental analysis, financial modeling | Investment bankers, equity research | Pricing requires direct negotiation |
| FactSet | Portfolio analysis, risk management | Asset managers, research analysts | Enterprise pricing, steep learning curve |
| Morningstar Investor | Independent research, fair value ratings | Long-term individual investors | Less suitable for short-term trading |
| Buy Wendy’s | Single-stock deep analysis | WEN investors seeking institutional rigor | Focused exclusively on Wendy’s |
Fundamental Analysis of QSR Stocks: What Separates Data from Insight
Quick-service restaurant stocks require analytical frameworks distinct from broader market analysis. The QSR industry operates on franchised unit economics, same-store sales trends, and capital-light models that create specific valuation dynamics.
A fundamental analysis of QSR stocks begins with unit-level economics. Same-store sales growth matters, but only in context: Is growth driven by pricing or traffic? Pricing-driven growth at declining traffic suggests consumer resistance. Traffic growth with flat pricing indicates genuine demand expansion. Most retail investors see the headline same-store sales number without distinguishing between these scenarios, and that distinction determines whether a stock is undervalued or a value trap.
Franchise royalty structures represent another critical analytical layer. Wendy’s operates a franchised model where company-operated restaurants contribute to reported profitability differently than franchise royalties. A restaurant generating $1 million in sales produces different profit margins depending on whether Wendy’s owns the unit or collects a royalty on it. Understanding the composition of system-wide sales versus company-operated sales is essential to modeling sustainable earnings power.
Capital allocation decisions signal management confidence. Dividend sustainability depends on free cash flow available after capital expenditures. A QSR franchisor with declining same-store sales but stable dividends faces pressure, either dividends are unsustainable or capital expenditures are being deferred. Separating these scenarios requires reading management commentary alongside the cash flow statement, not just the headline dividend yield.
Technology adoption represents an emerging analytical dimension. Wendy’s FreshAI drive-thru technology, for example, affects unit economics through labor cost reduction and order accuracy improvement. But quantifying this impact requires synthesizing operational data, management guidance, and competitive benchmarking, not just reading the financial statement line items.
Key Metrics That Signal Franchise Health
Restaurant franchise stocks present specific metrics that professional analysts track but generic platforms often miss:
Same-Store Sales Trends (Comparable Store Sales): Growth or decline in sales at restaurants open for at least 12 months, adjusted for new unit openings and closures. This metric isolates organic performance from expansion effects.
Unit Economics and Royalty Rates: The percentage of franchise sales collected as royalties, combined with average unit volumes. Higher average unit volumes with stable royalty rates indicate franchise strength.
Company-Operated vs. Franchised Mix: The percentage of system-wide sales from company-operated restaurants versus franchise royalties. This composition affects earnings quality and capital intensity.
Capital Expenditure Intensity: Total capital spent relative to system-wide sales. Lower capital intensity indicates a more capital-efficient model, freeing cash for dividends or debt reduction.
Dividend Payout Ratio: Dividends paid relative to free cash flow. A payout ratio above 100% signals unsustainable distributions.
Technology Adoption Rates: Percentage of units adopting new technologies (mobile ordering, AI drive-thru, digital loyalty) and measurable impact on unit volumes or labor costs.
These metrics require cross-referencing multiple sections of 10-K filings, earnings call transcripts, and investor presentations. A platform that surfaces these metrics with context, showing historical trends, peer comparisons, and management commentary, transforms raw data into actionable analysis.
Data Quality vs. Data Quantity: What Actually Moves Valuation
The proliferation of financial data has created a paradox: more information available than ever before, yet interpretive clarity declining.
High-quality data focuses on metrics that move valuation. For a restaurant franchisor, this means same-store sales trends, unit growth, capital allocation, and dividend sustainability, not the 50-page list of SEC filing line items. Professional analysis prioritizes signal over noise.
Quantity of data can obscure rather than clarify. A retail investor with access to 10 years of quarterly financial statements but no framework for interpreting them faces analysis paralysis. Which metrics matter most? How do you weight conflicting signals? Does a decline in same-store sales offset an increase in unit count? Without interpretive structure, the data becomes overwhelming rather than enlightening.
Data quality also reflects timeliness and relevance. Real-time stock pricing has minimal value for long-term investors; earnings guidance and management commentary matter more. For dividend investors specifically, historical payout ratios and free cash flow trends carry more weight than intraday price volatility.
Buy Wendy’s emphasizes data quality by filtering institutional-grade financial information through frameworks specific to Wendy’s business model. Rather than presenting every data point available, the platform surfaces the metrics that actually determine valuation: franchise economics, technology impact on unit profitability, dividend sustainability, and competitive positioning. This filtering transforms data abundance into analytical clarity.
Practical Workflow Integration: From Raw Data to Investment Thesis
Professional investors follow systematic workflows that convert raw financial data into investment decisions. Individual investors often lack this structure, jumping from data point to conclusion without intermediate analysis steps.

A practical workflow begins with hypothesis formation. Rather than asking "Is Wendy’s a good stock?" ask "Is Wendy’s undervalued relative to its franchise economics and dividend sustainability?" This specificity focuses analysis on metrics that matter.
Step two involves data collection and standardization. Gather the relevant metrics, same-store sales trends, unit counts, capital expenditures, free cash flow, dividend payments, across multiple quarters or years. Standardize the presentation so trends become visible. A simple spreadsheet tracking quarterly same-store sales growth over five years reveals patterns invisible in individual quarterly reports.
Step three applies interpretive frameworks. Compare Wendy’s metrics to historical performance and peer benchmarks. Has same-store sales growth accelerated or decelerated? Is the dividend payout ratio sustainable? How does unit economics compare to competitors? These comparisons transform raw numbers into context.
Step four synthesizes findings into an investment thesis. A coherent thesis might read: "Wendy’s trades at a discount to historical valuation multiples despite stable same-store sales, growing unit count, and a sustainable dividend yield. The FreshAI technology adoption should improve unit economics over the next 12-24 months, providing upside to current valuations. Downside risk exists if same-store sales decline accelerates, but current metrics suggest the dividend remains sustainable even under moderate negative scenarios."
This thesis-based approach differs fundamentally from data-driven speculation. It acknowledges both bull and bear cases, specifies the metrics that would invalidate the thesis, and provides a framework for monitoring the investment over time.
Professional-level analysis tools support this workflow by organizing data into decision-relevant formats. Rather than forcing investors to manually compile data from 10-K filings and earnings calls, platforms like Buy Wendy’s pre-compile the relevant metrics with historical context and peer comparisons. This acceleration of the workflow, from data collection to thesis formation, represents the practical value of professional-grade analysis.
Key Takeaways
The valuation gap between retail investors and professional analysts reflects not data access but interpretive framework. Raw financial information has become democratized; the ability to extract meaning from it remains concentrated.
Restaurant franchise stocks like Wendy’s require domain-specific analysis that generic platforms don’t provide. Unit economics, same-store sales trends, capital allocation, and technology adoption impact valuation in ways that require synthesis across multiple data sources.
Data quality matters more than quantity. A curated set of decision-relevant metrics, same-store sales, unit growth, dividend payout ratios, capital intensity, moves valuation more meaningfully than comprehensive coverage of every SEC filing line item.
Professional-level analysis becomes accessible to individual investors not by replicating Bloomberg Terminal’s data breadth, but by providing institutional-grade interpretation of the data that matters most. For Wendy’s investors specifically, this means frameworks that translate earnings reports and capital allocation decisions into coherent investment theses.
The best stock analysis tools for retail investors match the analytical depth of the stock being analyzed. A complex franchisor like Wendy’s benefits from specialized analysis; a simple, stable business might require less interpretive depth. Matching analytical rigor to stock complexity is itself a form of professional discipline.
For investors seeking to move beyond headline data points and develop institutional-grade analysis of Wendy’s, Buy Wendy’s provides the frameworks and synthesis needed to form independent investment views. The platform distills complex franchise economics, technology impact, and dividend sustainability into actionable analysis, transforming raw financial data into the kind of clarity that separates informed decisions from speculation. Visit Buy Wendy’s Stock & Investor Insights for detailed analysis to access comprehensive research on Wendy’s valuation, dividend sustainability, and technology impact.
Frequently Asked Questions
What is the difference between raw stock data and professional financial analysis?
Raw stock data includes prices, trading volumes, and historical performance, the mechanics of the market. Professional financial analysis interprets that data through valuation models, competitive positioning, management quality, and forward-looking thesis development. A retail investor might see Wendy's dividend yield; a professional analyst contextualizes that yield against franchise unit economics, same-store sales trends, and capital allocation strategy to assess sustainability. One is observation; the other is judgment informed by domain expertise.
How can retail investors access professional-level financial research without paying institutional prices?
Retail investors can access institutional-quality insights through platforms tailored to individual investors, independent research services focused on specific companies, and free SEC filings (10-K, 10-Q, 8-K) from the SEC website. Buy Wendy's, for example, distills complex financial data into actionable analysis specifically for individual investors interested in The Wendy's Company. The key is finding research that bridges the gap between raw data and interpreted insight, not all free sources do this equally well.
Why is fundamental analysis critical for evaluating restaurant franchise stocks?
Restaurant franchise stocks like Wendy's (WEN) depend on unit-level profitability, franchisee health, and same-store sales trends, metrics that don't appear in headline stock prices. Fundamental analysis examines franchise economics, menu strategy, technology investments (like AI drive-thru systems), and competitive positioning within the QSR sector. Without this lens, investors miss the drivers that actually determine long-term value and dividend sustainability. Price alone reveals nothing about whether a stock is cheap because it's undervalued or cheap because it's deteriorating.
What are the limitations of relying solely on automated stock valuation tools?
Automated tools apply generic valuation formulas to publicly available data, they cannot account for management execution, competitive moats, technology adoption curves, or franchise-specific risks. A tool might calculate a target price for Wendy's based on historical multiples, but it cannot assess whether the AI drive-thru rollout will materially improve unit economics or whether franchisees have the capital to invest in it. These qualitative factors require human analysis and industry expertise. Automated tools are useful as a starting point, not as a substitute for research.
This article was written using GrandRanker