Wendy’s U.S. average unit volume (AUV) stood at approximately $2.1 million for franchised locations and roughly $2.3 million for company-operated restaurants in 2024, according to Restaurant Dive’s reporting on Project Fresh. These figures derive from Wendy’s Franchise Disclosure Document (FDD) Item 19 and the 2024 Form 10-K filed with the SEC, which define AUV as average annual gross sales across surveyed U.S. franchised restaurants operating for 52 consecutive weeks. The system is overwhelmingly franchised, with company-operated units representing a small minority of the roughly 5,700 U.S. locations, so the $2.1M franchised figure is the operationally relevant benchmark for most investors and prospective operators.
$2.1M — reported 2024 U.S. franchised AUV, per Wendy’s FDD Item 19 and trade press reporting. Top-quartile locations reach approximately $2.7M; bottom-quartile locations fall near $1.5M.
Key Takeaways
Wendy’s 2024 franchised AUV of approximately $2.1M sits at a plateau that Project Fresh and FreshAI are explicitly designed to break, making the next two quarters of same-store sales data the most important near-term signal for both investors and franchisees.
| Point | Details |
|---|---|
| 2024 franchised AUV | Wendy’s U.S. franchised AUV was approximately $2.1M; company-operated units averaged roughly $2.3M. |
| Wide quartile spread | Top-quartile locations reach ~$2.7M; bottom-quartile locations fall near $1.5M, driving closure reviews. |
| Project Fresh capital shift | Wendy’s reallocated at least $20M from development to existing-unit improvements to lift per-unit sales. |
| Royalty sensitivity | At ~4.5% royalty rate, each $100K AUV shift across the franchised system moves consolidated royalties materially. |
| Buywendys tracking | Buywendys publishes AUV-linked valuation models and quarterly earnings breakdowns for investors modeling WEN. |
Table of Contents
- What recent initiatives are moving Wendy’s average unit volume?
- How has Wendy’s AUV trended over multiple years?
- How does Wendy’s define and calculate AUV?
- How does Wendy’s AUV compare to major QSR peers?
- What does Wendy’s AUV mean for investors and franchisees?
- How we compiled these AUV figures and where to verify them
- Why the AUV number matters more right now than it has in years
- Wendy’s AUV analysis, deeper than the headline number
- Primary sources and further reading
- Sources
What recent initiatives are moving Wendy’s average unit volume?
Wendy’s management has signaled a clear strategic pivot: prioritize per-unit economics over unit count growth. Several programs are directly tied to AUV improvement.
- Project Fresh ($20M reallocation): Wendy’s redirected at least $20 million away from new-unit development toward store-level improvements, including targeted marketing spend, operational upgrades, and remodel support. Restaurant Dive confirmed management’s explicit goal is lifting U.S. AUV through this capital shift.
- Unit review and closure risk: Restaurant Business Online reported that a mid-single-digit percentage of U.S. restaurants were under active review or at risk of closure, reflecting a deliberate shift from aggressive unit growth to maximizing unit-level economics at existing locations.
- FreshAI drive-thru deployment: Wendy’s FreshAI technology is being rolled out across drive-thru lanes to improve order accuracy and throughput, both of which feed directly into per-unit sales capacity.
- Menu pricing and daypart optimization: Management has leaned on selective price increases and breakfast daypart expansion to support AUV without requiring foot traffic growth.
Pro Tip: Watch the quarterly same-store sales (SSS) figure alongside AUV. SSS captures momentum within the existing base; AUV captures the absolute productivity level. A rising SSS on a flat AUV base signals pricing power; a flat SSS on a rising AUV base often reflects mix shift or new daypart contribution.
How has Wendy’s AUV trended over multiple years?
The multi-year trajectory shows steady growth through the post-pandemic recovery, with the pace moderating more recently. Statista’s longitudinal data on Wendy’s tracks average sales per unit from 2017 through 2024, confirming the directional trend below.
The system added roughly $500,000 in average per-unit sales between 2017 and 2022, driven by a combination of menu price increases, digital ordering adoption, and breakfast daypart expansion. Growth has plateaued near the $2.1M level, which is precisely why Project Fresh exists.
Distribution matters as much as the average. FDD-derived data shows top-quartile U.S. franchised locations generating approximately $2.7M annually, while bottom-quartile locations fall near $1.5M. That $1.2M spread between quartiles is wider than the entire AUV of many smaller QSR concepts, and it explains why a mid-single-digit percentage of units face closure review.
The FDD Item 19 survey typically covers several thousand qualifying U.S. franchised restaurants that operated for the full 52-week measurement period. New units, units that changed ownership mid-year, and nontraditional locations (airports, travel plazas) may be excluded or reported separately, which affects how representative the headline figure is for any specific location.
How does Wendy’s define and calculate AUV?
In Wendy’s FDD and annual SEC filings, AUV is defined as the arithmetic mean of annual gross sales reported by franchised U.S. restaurants that operated for the full 52-consecutive-week measurement period. Gross sales include all customer receipts before any deductions for discounts, coupons, or royalties. Key measurement rules and caveats:
- 52-week requirement: Only restaurants open for the full measurement year are included. This systematically excludes new openings and recently closed units, which tends to make the reported AUV slightly higher than the true system average.
- Franchised vs. company-operated: The FDD Item 19 figure covers franchised locations. Company-operated restaurants are reported separately in the 10-K and typically carry a higher AUV (approximately $2.3M in 2024) because Wendy’s tends to retain higher-volume urban and suburban locations.
- Nontraditional units: Locations in airports, college campuses, and transportation hubs may be reported in a separate cohort. Including them can depress the average for traditional freestanding units; excluding them can inflate it.
- New-unit cohort: Wendy’s corporate blog cites an AUV of approximately $1.96M for a new-restaurant cohort in the FDD, meaningfully below the system average, and explicitly cautions that individual results vary widely across the min-to-max range.
- Mean vs. median: The FDD typically reports the arithmetic mean. Because high-volume urban units pull the mean upward, the median AUV for a prospective franchisee in a suburban or rural market may be closer to the bottom-quartile figure than the headline number suggests.
Understanding these rules is not optional for anyone building a valuation model or underwriting a franchise acquisition. The headline $2.1M figure and the $1.96M new-unit figure can both be correct simultaneously because they measure different cohorts under different inclusion rules.
How does Wendy’s AUV compare to major QSR peers?
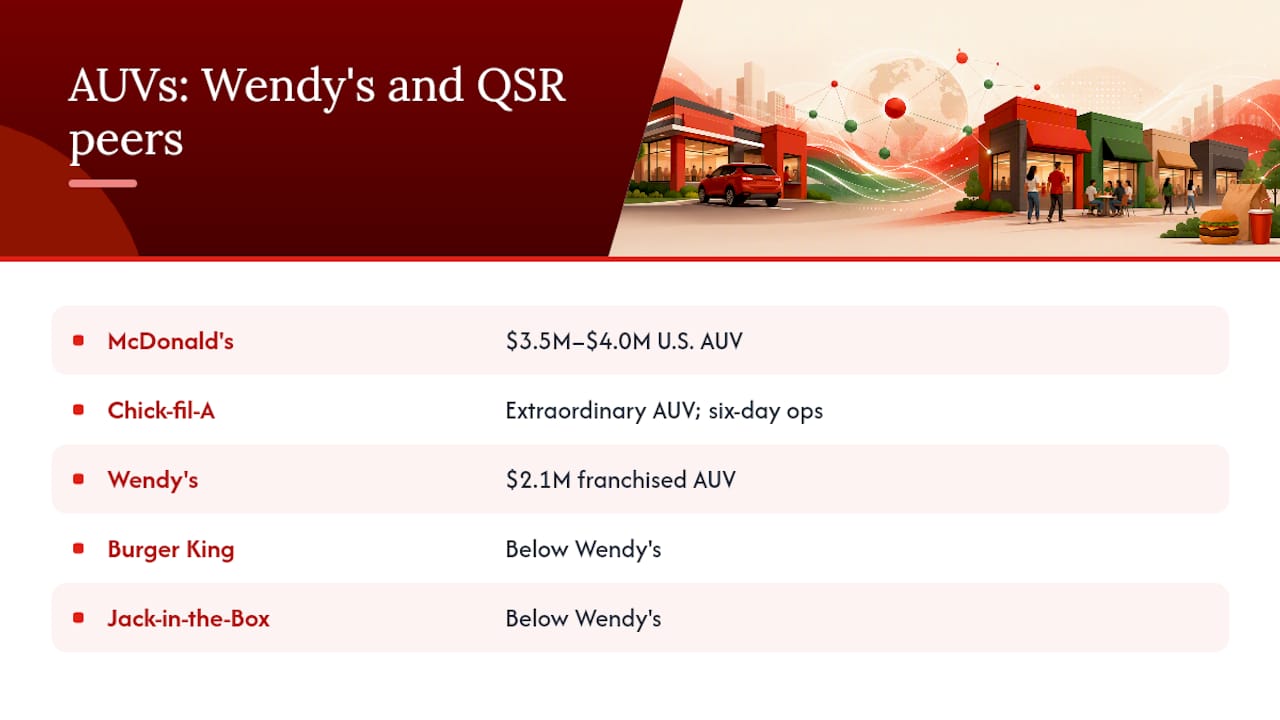
Wendy’s $2.1M franchised AUV places it above several burger-chain peers but well below McDonald’s, which has historically reported U.S. AUVs in the $3.5M–$4.0M range. Nation’s Restaurant News ranked Wendy’s among the higher-AUV burger chains, noting its approximately $2.1M figure alongside system size for comparability.
Two measurement differences make cross-brand comparisons imprecise. First, Chick-fil-A’s extraordinary AUV reflects six-day operation and a highly selective franchisee model, not a directly comparable unit economics structure. Second, brands with large nontraditional footprints (airports, stadiums) can see their reported AUV move significantly depending on whether those units are included. Wendy’s sits in a defensible mid-tier position, above Burger King and Jack in the Box, but the gap to McDonald’s is substantial enough to explain the company’s emphasis on operational modernization.
What does Wendy’s AUV mean for investors and franchisees?
AUV is the single most important input in Wendy’s royalty revenue model. Franchised units translate into a material change in consolidated royalty income.
For franchisees, the math is more direct. A typical Wendy’s buildout runs $1.5M–$2.5M in total investment depending on format and market. That implies a payback period of approximately 4–8 years on a median-performing unit, consistent with franchise underwriting analysis that uses FDD Item 19 data as the baseline.
The risk signal to watch is the bottom quartile. Units generating near $1.5M annually face a materially different economic picture: royalties, rent, and labor costs consume a larger share of a smaller revenue base, compressing or eliminating unit-level profit. The mid-single-digit percentage of U.S. restaurants currently under review for closure, as reported by Restaurant Business Online, almost certainly skews toward this bottom-quartile cohort.
Pro Tip: When modeling Wendy’s (WEN) royalty revenue, use the franchised AUV figure, not the blended or company-operated figure. The royalty stream is almost entirely a function of franchised unit sales. Blending in company-operated AUV overstates the royalty-relevant base and distorts your revenue forecast.
Rising AUV is a positive signal for WEN stock valuation because it expands the royalty base, supports franchisee profitability (reducing closure risk), and improves the company’s leverage on fixed overhead. Falling AUV, by contrast, compresses franchisee margins, increases closure probability, and can trigger a negative feedback loop where closures reduce system scale and further pressure marketing fund efficiency.
How we compiled these AUV figures and where to verify them
The figures in this article draw from a defined set of primary and secondary sources, each with a specific role in the verification chain.
- Primary: Wendy’s FDD Item 19 — the definitive source for franchised U.S. AUV, sample size, min/max range, and cohort definitions. Updated annually; the most recent version is typically filed in the first quarter of each calendar year. Item 19 footnotes specify which units were excluded and why.
- Primary: Wendy’s 2024 Form 10-K (SEC) — provides company-operated AUV, system unit counts, and same-store sales data. Available at SEC EDGAR and reconcilable against FDD figures.
- Secondary: Restaurant Dive and Restaurant Business Online — trade press that reports management commentary and AUV figures from earnings calls and investor presentations. Useful for near-real-time updates between FDD filings.
- Secondary: Statista — aggregates multi-year AUV and unit count data useful for trend analysis; figures should be reconciled against primary FDD/10-K sources.
- Secondary: Nation’s Restaurant News and FranchiseInvestorData — peer ranking and quartile distribution data; treat as directional rather than definitive.
To pull the primary figures yourself: obtain the current FDD from Wendy’s franchising team or a state franchise registry (several states require public filing), navigate to Item 19, and read the footnotes carefully before using the headline AUV in any model. Minor discrepancies between the FDD and trade press reporting typically reflect rounding, cohort differences, or the timing of when management disclosed preliminary figures versus the final audited Item 19 table.
Why the AUV number matters more right now than it has in years
The conventional read on Wendy’s AUV is that $2.1M is a respectable mid-tier figure, and that the gap to McDonald’s is simply structural. That framing is too passive. What makes the current AUV data genuinely consequential is the combination of factors converging simultaneously: a deliberate capital reallocation away from unit growth, a formal review of underperforming locations, and a technology deployment (FreshAI) that has a plausible mechanism for lifting throughput at existing units.
The $20M Project Fresh investment is not large relative to Wendy’s system revenue, but the signal it sends about management’s priorities is. When a predominantly franchised company redirects development capital toward existing-unit improvement, it is effectively betting that AUV growth is a more reliable path to royalty revenue expansion than unit count growth. That is a defensible thesis given where the bottom quartile sits, but it requires execution. The next two to three quarters of same-store sales data will reveal whether Project Fresh is generating measurable lift or whether the AUV plateau is structural.
For franchise investors, the unit review process is the more immediate variable. A mid-single-digit percentage of closures would modestly reduce system count but could meaningfully improve the reported AUV average by removing the lowest-performing units from the calculation. That statistical effect is worth modeling separately from any genuine operational improvement.
Wendy’s AUV analysis, deeper than the headline number
Investors and franchisees who want to move beyond the $2.1M headline figure and build a defensible model need access to the underlying drivers: royalty sensitivity, same-store sales trajectory, Project Fresh rollout metrics, and the FreshAI throughput data that Wendy’s has not yet fully disclosed publicly.
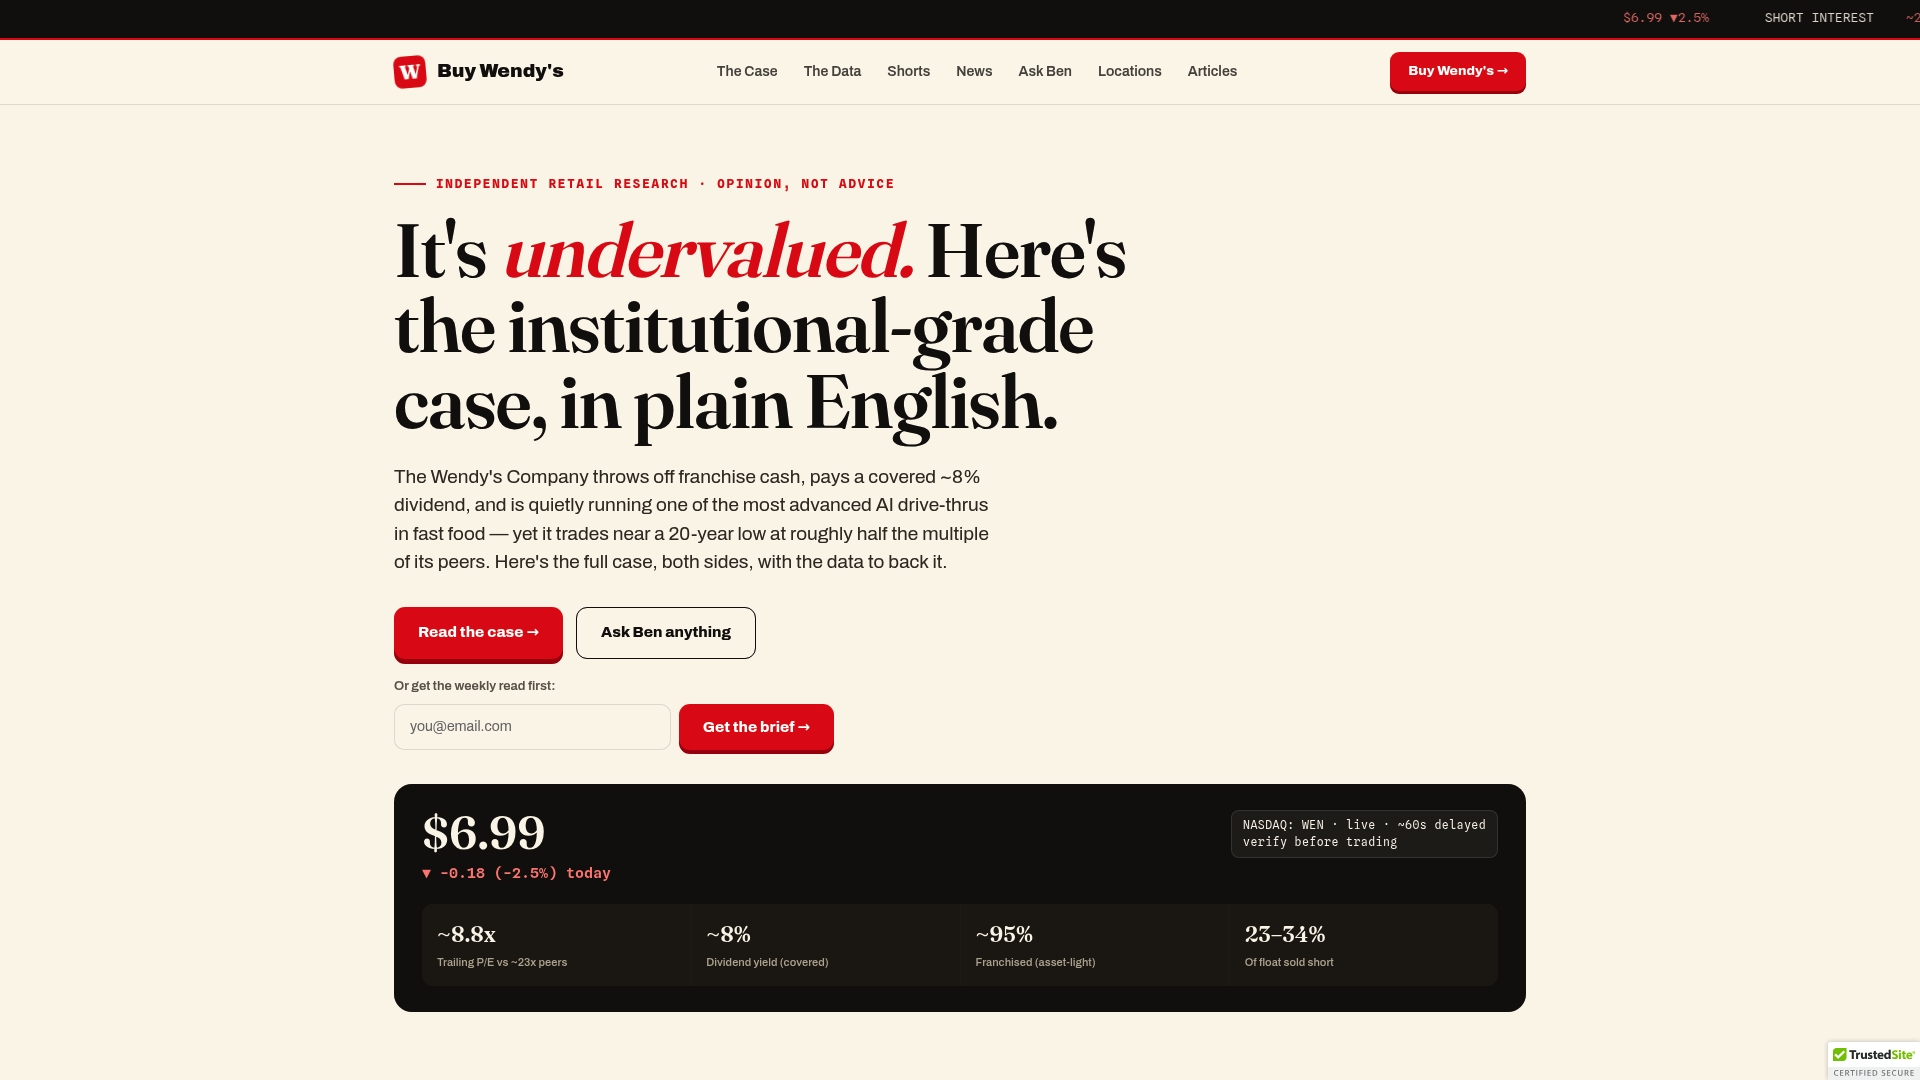
Buywendys tracks Wendy’s financial performance, franchise economics, and operational data in one place, updated with each earnings release. The platform’s valuation model resources incorporate AUV assumptions directly into royalty revenue projections, and the quarterly earnings breakdowns reconcile same-store sales with system AUV movements so you can see exactly what is driving the number each period. For investors assessing whether WEN is currently undervalued relative to its AUV-driven cash flows, the analysis is available now.
Primary sources and further reading
The following documents and reports are the recommended starting points for verifying or extending the analysis in this article.
- Wendy’s 2024 Form 10-K (SEC EDGAR) — primary source; contains unit counts, company-operated AUV, and Item 19 references. Primary.
- Wendy’s FDD Item 19 (via franchising team or state registry) — definitive franchised AUV table with sample size, min/max, and cohort footnotes. Primary.
- Restaurant Dive: Project Fresh and 2024 AUV reporting — management commentary and AUV figures from earnings disclosures. Secondary.
- Restaurant Business Online: unit review and closure risk — mid-single-digit closure risk reporting and operational shift context. Secondary.
- Statista: Wendy’s multi-year AUV and unit data (2017–2024) — longitudinal trend data for charting and year-over-year comparison. Secondary aggregate.
- Nation’s Restaurant News: burger chain AUV rankings — peer context for Wendy’s relative AUV standing among burger chains. Secondary.
This article is general information, not a substitute for advice from a qualified financial advisor. Consult a qualified financial professional about your own circumstances before acting on anything here.
Sources
- The Wendy’s Company 2024 Form 10-K / annual report (SEC)
- Why you should become Wendy’s franchisee | Wendy’s (corporate blog)
- Wendy’s to invest at least $20M to boost AUV | Restaurant Dive
- Wendy’s is taking a hard look at its restaurants as it works to improve sales | Restaurant Business Online
Recommended
- Wendy’s Quarterly Earnings Breakdown: A 2026 Guide – Buy Wendy’s
- Wendy’s Quarterly Earnings Breakdown: A 2026 Guide
- Wendy’s Investor Presentation Explained: Page-by-Page Analysis for WEN Stock Investors – Buy Wendy’s
- The Week Wendy’s Stock Gave Back the Rally: WEN vs. McDonald’s, and What the Volume Tape Reveals – Buy Wendy’s