
average unit volume (AUV) growth under Project Fresh. The company expects to return a substantial amount of cash to shareholders in 2025. Investors should read this as a turnaround signal: less fixed-dividend certainty, more operational reinvestment, and a bet that AUV recovery pays off before net-unit growth resumes.
TL;DR:
- Wendy’s plans to allocate approximately 50% to 60% of earnings as dividends, linking payouts directly to adjusted earnings rather than fixed amounts.
- The company has authorized up to 200 million dollars for opportunistic share repurchases in 2025, but without a fixed schedule, depending on cash flow and leverage levels.
- Capital expenditures are guided at 100 to 110 million dollars in 2025, with about half directed toward technology, marketing, and remodeling instead of new restaurant construction.
- Management prioritizes reinvestment in existing U.S. restaurants and international net unit growth over dividends and buybacks, reflecting a shift toward AUV recovery.
- Deleveraging efforts and system-wide AUV performance will be key indicators of progress, especially before securitization maturities around 2026 to 2028.
Table of Contents
- What Wendy’s Officially Disclosed About Its Capital Allocation Policy
- How Does Wendy’s Rank Its Capital Priorities?
- What Does the 50% to 60% Payout Band Mean for Dividends?
- Share Repurchases: What’s the Timing and EPS Impact?
- How Does Wendy’s Manage Debt and Leverage Targets?
- Where Is Project Fresh Capital Actually Going?
- What Should Investors Watch in Wendy’s Capital Strategy?
- How Buywendys Models Wendy’s Capital Allocation
- An Editorial Take on Wendy’s Capital Reset
- Model This Policy Yourself With Buywendys
- Sources
- FAQ
What Wendy’s Officially Disclosed About Its Capital Allocation Policy
The core disclosures came through three channels investors should treat as primary sources rather than secondhand summaries: a year-end earnings release, a dedicated investor-day announcement, and supporting SEC exhibits. Each carries specific numbers that anchor the rest of this analysis.
The company’s fourth-quarter and full-year results release formally introduced the updated capital allocation policy alongside 2025 guidance. That release is where the payout ratio and repurchase figures first appeared in writing, not in a slide deck or a verbal aside on an earnings call. Wendy’s followed with an investor-day announcement unveiling Project Fresh, the strategic plan that reframes how capital moves inside the system. A related SEC exhibit filled in the capex range and the combined cash-return figure that the press release only summarized at a high level.
Here’s the headline data investors need to track, pulled directly from those three sources:
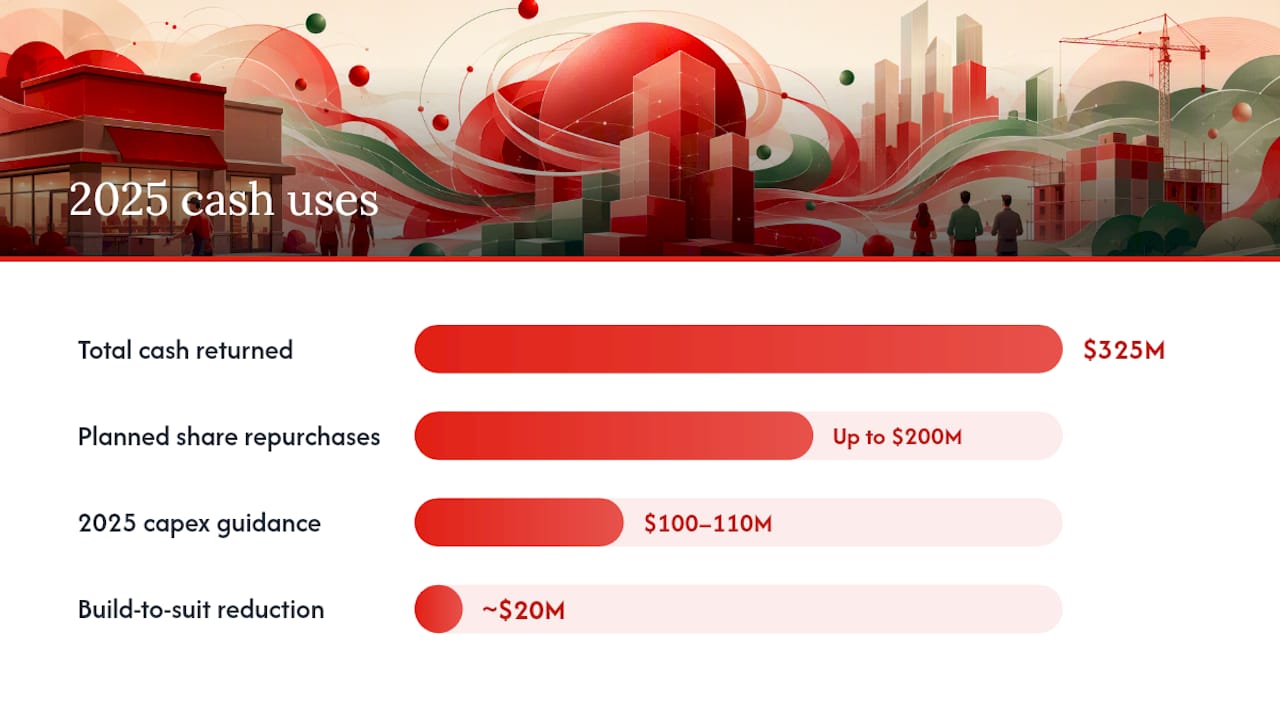
- Target dividend payout ratio: 50% to 60% of adjusted earnings, a new formal band replacing the prior fixed-dividend approach.
- Planned 2025 share repurchases: up to $200 million, described as opportunistic rather than committed on a fixed schedule.
- Total 2025 cash returned to shareholders: approximately $325 million, combining dividends and buybacks.
- 2025 capital expenditure guidance: $100 million to $110 million, trimmed from prior build-to-suit-heavy spending.
- Build-to-Suit reduction: roughly $20 million cut in 2025, redirected toward U.S. technology and marketing investment.
What makes this disclosure notable is the timing. Wendy’s paired the capital allocation reset with its full-year results rather than waiting for a separate investor event, which suggests management wanted the market to see the dividend and buyback changes as inseparable from the broader earnings picture. The investor-day materials that followed added texture: they explained why the company is willing to trade some near-term dividend certainty for AUV-focused reinvestment.
For analysts building models, the practical takeaway is that these aren’t scattered data points from a single quarter. They form a coherent package: a lower, more flexible dividend framework, a modest but real buyback commitment, and a capex mix that leans harder into revenue-driving investments than into new restaurant construction. Anyone modeling Wendy’s financial strategy going forward needs all three pieces working together, not in isolation.
How Does Wendy’s Rank Its Capital Priorities?
Management laid out a clear hierarchy for where cash goes first, and the order matters more than any single number. Understanding capital distribution at Wendy’s means understanding this sequence, because it tells you what gets funded even in a weaker quarter and what gets cut first.
The stated priorities, in order:
- Invest in the business. In the U.S., this means AUV growth: kitchen technology, marketing, remodels, and digital ordering infrastructure. Internationally, the emphasis shifts toward net unit growth, since overseas markets are earlier in their development curve.
- Pay an attractive dividend. The new 50% to 60% payout band sits second, a deliberate demotion from the fixed-dividend approach many income investors had grown used to.
- Maintain a strong balance sheet. Leverage discipline and debt maturity management come before any additional shareholder returns beyond the dividend.
- Return excess cash opportunistically through buybacks. The $200 million 2025 authorization exemplifies this. It’s flexible capital return, not a scheduled quarterly commitment.
This ordering is a meaningful change in Wendy’s investment priorities. A fixed dividend that ranked ahead of reinvestment told the market that income stability mattered more than growth spending. A payout band that sits below business investment tells a different story: management believes AUV recovery is the higher-return use of a dollar right now, and it’s willing to ask income-focused shareholders to accept some near-term flexibility in exchange.
The mechanism behind priority one deserves attention. Management has described a returns-based approach to franchisee investment, meaning capital gets steered toward projects with the clearest payback period and the highest projected return, rather than spread evenly across the system. That’s a more surgical model than blanket capex increases. It means a remodel program in a market showing strong same-store sales response gets funded ahead of a similar program in a flatter market.
Pro Tip: When you see a company move from a fixed dividend to a payout ratio band, check whether the stated priority order actually placed reinvestment ahead of the dividend. If it did, model the dividend as a residual of earnings and reinvestment needs, not as a standalone number you can extrapolate from history.
This kind of resource allocation at Wendy’s also explains why the buyback sits last. Repurchases are the most discretionary form of capital return, easiest to pause if AUV investment needs more runway or if leverage creeps above target. That flexibility is a feature for management, but it’s a risk factor for anyone modeling consistent EPS accretion from the buyback program.
What Does the 50% to 60% Payout Band Mean for Dividends?
The payout band replaces dollar-certainty with earnings-linked flexibility, and that trade-off is the single most important thing to model correctly. Instead of a fixed per-share dividend that holds steady regardless of earnings swings, Wendy’s dividend per share will now move with adjusted earnings, landing somewhere inside a defined range each year.
Here’s how that mechanic plays out across a simplified range of adjusted earnings-per-share scenarios:
| Adjusted EPS Scenario | Payout at 50% | Payout at 60% | Resulting Dividend Range |
|---|---|---|---|
| Lower earnings year | Lower dividend floor | Slightly higher floor | Narrower band, less cash |
| Base-case earnings | Mid-range dividend | Mid-range dividend, higher end | Moderate band width |
| Stronger earnings year | Higher dividend floor | Highest dividend in range | Widest potential payout |
The table illustrates the structural point rather than precise dollar figures, since actual adjusted EPS depends on quarterly performance the company has not locked in for future periods. The mechanism is what matters for financial planning purposes: a payout band scales the dividend automatically with earnings, so income investors get a dividend that breathes with the business instead of one that management has to actively decide to cut or freeze during a rough stretch.
A payout band is a flexibility tool, not a dividend cut in disguise, but it functions like one in a down earnings year. That’s the honest way to characterize what happened here. When Wendy’s later reduced its declared dividend in 2026 while reiterating its turnaround priorities, that reduction was a direct, mechanical consequence of the new band interacting with softer adjusted earnings. It wasn’t an ad hoc decision made in isolation. It was the payout formula doing exactly what a payout formula does.
For dividend safety analysis, the right approach is reconciling adjusted EPS to the company’s own free cash flow definition, which nets cash from operations against capex and franchise development fund adjustments, rather than relying on simple GAAP net income. GAAP net income can be distorted by impairments, refranchising gains, or one-time charges that don’t reflect the cash actually available for distribution. Company-defined free cash flow is the cleaner lens, and it’s the one that maps most directly to what the payout band is actually measuring against.
The risk to continuation isn’t really about the band itself. It’s about whether adjusted earnings stabilize enough for the dividend to sit predictably in the range rather than swinging near the bottom every other year. That’s a question about AUV execution, not about the payout mechanism.
Share Repurchases: What’s the Timing and EPS Impact?
Wendy’s authorized up to $200 million in 2025 share repurchases, and the language accompanying that authorization leans heavily on the word “opportunistic,” which is a meaningful qualifier for anyone modeling buyback timing. It signals management isn’t committing to a steady quarterly cadence of purchases regardless of price or balance-sheet conditions.
A few practical points shape how this program is likely to unfold:
- The $200 million figure is a ceiling, not a floor. Actual repurchases in any given quarter could come in well below that pace depending on free cash flow availability and leverage trends.
- Buybacks sit behind business investment and the dividend in the stated priority order, meaning they’re the first lever management would pull back if AUV investment needs more capital or if deleveraging falls behind schedule.
- Repurchase timing interacts directly with the company’s deleveraging efforts. Retiring shares and paying down debt both compete for the same free cash flow pool.
On a rough sensitivity basis, a $200 million repurchase program executed against a share count in the tens of millions can meaningfully reduce shares outstanding over a full year, which mechanically lifts EPS even with flat net income. The actual percentage impact depends on the average execution price and the pace of buying, both of which management has left deliberately unspecified. That vagueness isn’t a flaw in the disclosure. It’s consistent with a company managing a turnaround, where locking in a rigid buyback schedule would remove flexibility that might be needed elsewhere.
The interaction with deleveraging is the part analysts most often underweight. A dollar spent on buybacks is a dollar not spent reducing leverage, and Wendy’s has explicit reasons to care about leverage given upcoming securitization maturities. Investors should watch quarterly filings for signs that repurchase pace is slowing when leverage runs hot and picking up when the balance sheet has more room. That pattern, if it appears, would confirm the buyback is genuinely being managed opportunistically rather than mechanically.
How Does Wendy’s Manage Debt and Leverage Targets?
Balance-sheet discipline sits third in the stated capital priority order, ahead of buybacks and functionally constraining how aggressive the dividend and repurchase program can be in any given year. Wendy’s operates under a whole-business securitization structure, a financing approach common among franchised restaurant systems, which comes with its own maturity schedule and refinancing considerations.
Recent earnings commentary has referenced securitization debt maturities and refinancing plans extending into the 2026 to 2028 window. Those maturities matter because refinancing terms in that period will depend heavily on prevailing interest rates and the company’s leverage profile at the time of refinancing. A business carrying leverage near the high end of its comfort range walks into a refinancing negotiation with less flexibility than one that has actively delevered.
Key elements of the debt and leverage picture:
- Wendy’s whole-business securitization structure ties debt service to system-wide royalty and rent cash flows, which is why franchise-driven revenue stability matters so much to credit quality.
- Maturities running into 2026 through 2028 create a multi-year refinancing runway rather than a single cliff event, giving management room to time market conditions.
- Deleveraging progress directly affects how much room exists for buybacks in any given year, since leverage discipline outranks opportunistic repurchases in the stated priority list.
This is where Wendy’s capital management gets genuinely interdependent. A slower-than-expected AUV recovery would pressure adjusted earnings, which pressures the dividend under the payout band, which in turn makes management more cautious about deploying cash toward buybacks instead of debt reduction. None of these levers move in isolation. Investors modeling any single piece, whether it’s the dividend, the buyback, or the leverage trajectory, need to model all three together, because management is explicitly treating them as a connected system rather than three separate line items.
Where Is Project Fresh Capital Actually Going?
Project Fresh translates the capital allocation policy into specific spending categories, and the details matter more than the branding. The plan’s stated pillars center on modernizing the U.S. business: kitchen technology, digital menu boards, marketing investment, and a returns-based remodel program, all aimed at lifting AUV before resuming aggressive net-unit growth domestically.
The capital reallocation is concrete rather than aspirational. Build-to-Suit spending, the capital historically used to fund new company or franchisee-built restaurants, is being cut by roughly $20 million in 2025. That freed-up capital is flowing toward technology and marketing investment in existing U.S. restaurants instead of new construction. Investor-day materials lay out target annual capex of approximately $115 million for 2025 through 2028, with development spending representing roughly half of that total and the remainder split between operations and technology.
Specific capital deployment examples worth tracking:
- Kitchen technology upgrades aimed at reducing order times and improving throughput during peak periods.
- Digital menu board rollouts designed to support dynamic pricing and promotional flexibility.
- FreshAI drive-thru technology, which represents one of the more visible technology investments tied to the AUV growth thesis.
- Franchisee remodel incentives structured around the returns-based model, prioritizing locations with the clearest payback.
The logic behind this shift, as described in Project Fresh materials, is that reallocating near-term U.S. capital from new construction toward technology and marketing should improve AUV faster than adding new units would, which in turn restores franchisee economics before the system pushes back into aggressive expansion. That’s a sequencing bet: fix the productivity of existing restaurants first, then grow the footprint once the unit economics justify it.
Pro Tip: Track same-store sales growth and franchisee reinvestment rates in remodeled units as leading indicators. If AUV improvement shows up in same-store sales within two to three quarters of a technology rollout, that’s the clearest early signal Project Fresh capital is working as designed.
Investors should expect the earliest visible signs of AUV improvement in same-store sales commentary and labor efficiency metrics, well before net-unit growth reaccelerates. The net-unit growth targets management set (3% to 4% long-term, with 5% to 6% systemwide sales growth ambitions cited in investor-day materials) are back-half priorities in this plan, not near-term ones.
What Should Investors Watch in Wendy’s Capital Strategy?
Folding this policy into a valuation model requires treating the dividend and buyback guidance as inputs to a range, not a fixed forecast. A DCF should treat the $200 million buyback authorization as a maximum case, with a base case that assumes partial utilization tied to free cash flow performance.
Several catalysts could move the stock meaningfully over the next several quarters:
- AUV execution signals. Sequential improvement in same-store sales tied to Project Fresh technology rollouts would validate the reinvestment thesis directly.
- Free cash flow stabilization. Confirmation that free cash flow is holding near or above the guided range supports both dividend durability and buyback capacity.
- Deleveraging milestones. Progress toward stated leverage targets ahead of upcoming securitization maturities reduces refinancing risk.
- Buyback completion pace. Whether the company approaches the full $200 million authorization or falls well short tells you how management is weighing buybacks against other priorities in practice.
The principal risks run in the opposite direction. Execution risk tops the list. Project Fresh assumes technology and marketing spending translates into AUV growth on a reasonable timeline, and any delay pushes out the entire sequencing plan. Commodity and labor cost inflation could compress the margin gains AUV growth is supposed to deliver, even if traffic and check size improve. Franchisee economics remain a watch item too. A returns-based capital model only works if franchisees have the balance-sheet capacity to co-invest in remodels and technology alongside company capital. And activist involvement is a background risk worth monitoring. A capital allocation reset paired with a dividend reduction is exactly the kind of situation that has historically attracted activist attention at other restaurant chains.
Practical metrics to track each quarter: same-store sales growth by segment, adjusted EPS relative to the payout band’s implied dividend, actual capex against the $100 million to $110 million guided range, cumulative share repurchases against the $200 million authorization, and leverage ratio trends ahead of the 2026 to 2028 securitization maturities. Reading these together, rather than any single figure in isolation, is the only way to judge whether this capital allocation reset at Wendy’s is on track.
How Buywendys Models Wendy’s Capital Allocation
Buywendys builds its analysis of Wendy’s financial strategy around three connected resources: a page-by-page walkthrough of the investor presentation covering Project Fresh’s capital-allocation slides, a dedicated dividend safety analysis that stress-tests the payout band against multiple earnings scenarios, and ongoing tracking of adjusted EBITDA drivers that feed into free cash flow capacity.
The methodology follows the same reconciliation approach the company itself recommends: starting from cash from operations, subtracting capex and franchise development fund adjustments, rather than treating GAAP net income as a proxy for distributable cash. That distinction matters because Wendy’s adjusted earnings figure and its free cash flow figure don’t move in lockstep every quarter, and a payout-band model built on the wrong base can overstate or understate dividend durability.
A simplified worked example shows how this maps in practice:
| Input | Illustrative Value | Resulting Output |
|---|---|---|
| Company FCF guidance basis | Cash from operations minus capex and fund adjustments | Base for payout calculation |
| Payout band applied | 50% to 60% of adjusted earnings | Range, not single figure |
| 2025 total cash return guidance | ~$325 million (dividends plus buybacks) | Combined shareholder return |
| 2025 capex guidance | $100 million to $110 million | Reinvestment baseline |
This structure lets analysts see where a change in one input, say, a capex overrun or an AUV-driven earnings beat, flows through to the dividend range and buyback capacity without needing to rebuild the entire model. It’s the same logic investors should apply whenever a company moves from a fixed dividend to an earnings-linked band: model the range, not a point estimate.
An Editorial Take on Wendy’s Capital Reset
The reallocation reads as credible, not cosmetic. Cutting Build-to-Suit spending by a specific, disclosed dollar figure while naming exact technology and marketing redirection targets is a different kind of commitment than a vague “we’re investing in growth” statement. Companies that want to obscure a dividend reduction don’t usually publish a payout band with explicit percentages and pair it with a named strategic plan investors can hold them accountable to next year.
That said, the demotion of the dividend to third in the priority order changes who this stock fits. Pure income investors chasing yield certainty should recognize that dividend per share will now track adjusted earnings, not management’s desire to avoid a headline-grabbing cut. Total-return investors and anyone running a value thesis on AUV recovery get a cleaner story: capital is flowing toward the highest-return use inside the system, which is exactly what you’d want to see from a franchised business working through a turnaround. Activist-minded investors should watch the leverage and buyback pacing closely, since that’s the most likely friction point if AUV recovery lags the plan’s implied timeline.
My four-quarter checklist: same-store sales trend direction, actual capex versus the $100 to $110 million guided range, buyback pace against the $200 million ceiling, and any change in leverage ratio commentary ahead of the 2026 to 2028 securitization maturities.
— Benjamin
Model This Policy Yourself With Buywendys
Reading the payout band and buyback numbers is one thing. Running them against your own earnings assumptions is another, and that’s where most retail investors stall out without a proper valuation framework.
Start with the stock valuation and professional analysis toolkit, which lets you test payout-band scenarios against your own adjusted EPS assumptions rather than relying on a single static estimate. Pair it with the restaurant stock growth evaluation framework if you’re weighing Wendy’s against other franchised operators managing similar capital-allocation trade-offs. Both are built from the same company disclosures covered in this analysis, so you’re modeling from the same numbers Wendy’s management is actually using.
This article is general information, not a substitute for advice from a qualified financial advisor. Consult a qualified financial professional about your own circumstances before acting on anything here.
Sources
- THE WENDY’S COMPANY REPORTS FOURTH QUARTER AND FULL-YEAR 2024 RESULTS, PROVIDES 2025 OUTLOOK, AND UPDATES ITS CAPITAL ALLOCATION POLICY
- THE WENDY’S COMPANY LAUNCHES ‘PROJECT FRESH,’ A STRATEGIC PLAN TO DRIVE GROWTH AND ENHANCE VALUE CREATION
- SEC filing (capital allocation and guidance excerpts)
FAQ
Who Is the Largest Shareholder of Wendy’s?
Wendy’s ownership is split between institutional investors, index funds, and company insiders, with the exact largest holder shifting over time as institutional positions change. Investors should check the company’s most recent proxy statement or filings for the current top holder rather than relying on older ownership snapshots.
Why Is Wendy’s Stock Struggling?
Wendy’s stock has faced pressure from softer same-store sales, a dividend reduction tied to the new payout band, and broader investor skepticism about execution timing on Project Fresh. The capital allocation reset itself reflects management addressing these headwinds by prioritizing AUV-driving investment over fixed dividend certainty.
How Much Debt Is Wendy’s In?
Wendy’s carries debt primarily through a whole-business securitization structure, with material maturities extending into 2026 through 2028 that will require refinancing. The company’s leverage management, including deleveraging progress ahead of those maturities, directly affects how much capital remains available for dividends and buybacks.
How Much Money Does a Wendy’s Owner Make?
Franchisee profitability at Wendy’s depends heavily on individual restaurant AUV, labor costs, and local market conditions, and the company doesn’t publish per-unit franchisee profit figures. Project Fresh’s returns-based investment approach is specifically designed to improve unit-level economics by directing capital toward locations with the clearest AUV payback.