
Royalty payments are a recurring deduction from gross sales, and they behave like a fixed tax on revenue regardless of how a store’s week went. The first number to check is not the royalty rate itself, but what remains after the entire fee stack is subtracted from gross profit.
TL;DR:
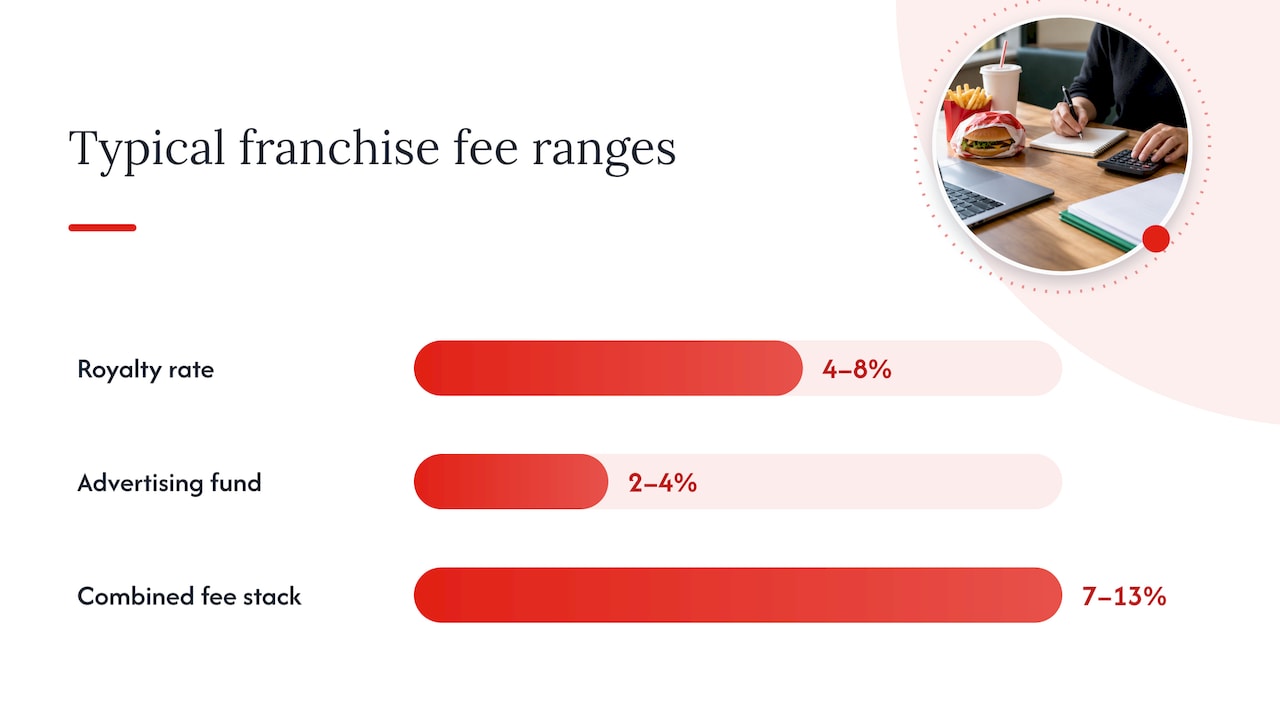
- Royalties are typically 4% to 8% of gross sales, with additional fees for marketing, technology, and initial training, often totaling 7% to 13% of revenue.
- A high fee stack can consume more than a quarter of a store’s gross profit, significantly reducing operating margins especially for low-margin businesses.
- The impact of royalty rates depends heavily on gross margin and unit volume, with lower margins making even modest percentages potentially destructive.
- Franchisors often report strong overall royalty revenue due to system-wide sales, but this does not necessarily reflect the profitability of individual units.
- Negotiating tiered royalties, fee caps, and transparency in marketing spends can help reduce the total cost burden on franchisees.
Table of Contents
- How royalties work: sales-based vs margin-based structures
- Typical royalty rates and what they mean against gross margin
- How royalties change store profit margins: two worked examples
- The fee stack and what to negotiate before signing
- Why franchisor royalty revenue looks different from store margins
- Reading SEC and FDD data: a public-filing example
- A due diligence checklist for verifying royalty claims
- Balancing royalty costs against support and fit
- BuyWendy’s resources for modeling franchise economics
- Primary sources and recommended reading
- Sources
- FAQ
How royalties work: sales-based vs margin-based structures
Franchise agreements almost always define royalties as a percentage of gross sales, collected whether the store is profitable that week or not. This sales-based royalty (SBR) model is dominant across quick-service and retail franchising because it is simple to audit and does not require the franchisor to see cost data. Margin-based royalties (MBR), which calculate the fee as a share of gross profit rather than revenue, are structurally different: academic comparisons of royalty structures find that MBRs can encourage lower retail prices, higher order quantities, and higher total channel profit in perishable-goods categories, because the franchisor’s take falls when the franchisee’s margin compresses. MBRs remain uncommon in practice, largely because sales-based royalties are easier to verify from point-of-sale data alone.
Royalties rarely travel alone. Most franchise agreements stack several recurring charges on top of the base royalty:
- A marketing or advertising fund fee, typically a separate percentage of gross sales, often 2% to 4%, pooled across the system for national and regional advertising.
- A technology or platform fee, which may be a flat monthly charge or a smaller percentage tied to point-of-sale and loyalty infrastructure.
- Training and initial fees, charged once at opening but relevant when comparing total first-year burden.
- Renewal fees, due at the end of the franchise term, usually smaller than the initial fee but still a line item worth modeling into long-run returns.
These figures live in specific, predictable places inside a Franchise Disclosure Document. Item 6 lists all recurring and one-time fees with their calculation basis and remittance schedule, while Item 19 covers financial performance representations, the only section where a franchisor is permitted to make earnings claims. Remittance is typically weekly or monthly, often drafted automatically from the franchisee’s bank account tied to point-of-sale reporting, which means royalty payments hit cash flow before the franchisee has a chance to net out other costs for the period.
Typical royalty rates and what they mean against gross margin
Royalty rates cluster in a fairly narrow band across most franchise categories, but the rate alone tells you little without knowing the gross margin it sits on top of.
- Royalty rates commonly fall between 4% and 8% of gross sales across quick-service and retail franchise systems.
- Advertising fund contributions typically add another 2% to 4% on top of the base royalty.
- Technology or platform fees add a smaller, often flat, monthly charge that still deducts from the same revenue base.
- Combined, a typical fee stack can run 7% to 13% of gross sales before rent, labor, and cost of goods are even considered.
Many franchisors voluntarily publish Item 19 performance data, and as of 2026 between 60% and 66% of franchisors include it in their FDDs, up from about 52% in 2014. That rising disclosure rate matters because Item 19 is the only authorized place for a franchisor to make an earnings claim, and its absence should prompt a closer look at franchisee-sourced numbers instead.
A royalty that looks low in isolation can still be heavy in practice. The rate is only half the equation. Gross margin and average unit volume (AUV) determine whether that rate is comfortable or crippling.
How royalties change store profit margins: two worked examples
The clearest way to see the effect of royalties is to run the same fee stack against two different margin profiles and watch how the leftover operating margin diverges.
Example A: high-gross-margin retailer. Assume a store generates — in annual revenue with a 50% gross margin, a 5% royalty, and a 3% advertising fund contribution.
- Gross profit: — times 50% equals $500,000.
- Royalty burden: — times 5% equals $50,000.
- Advertising fund burden: — times 3% equals $30,000.
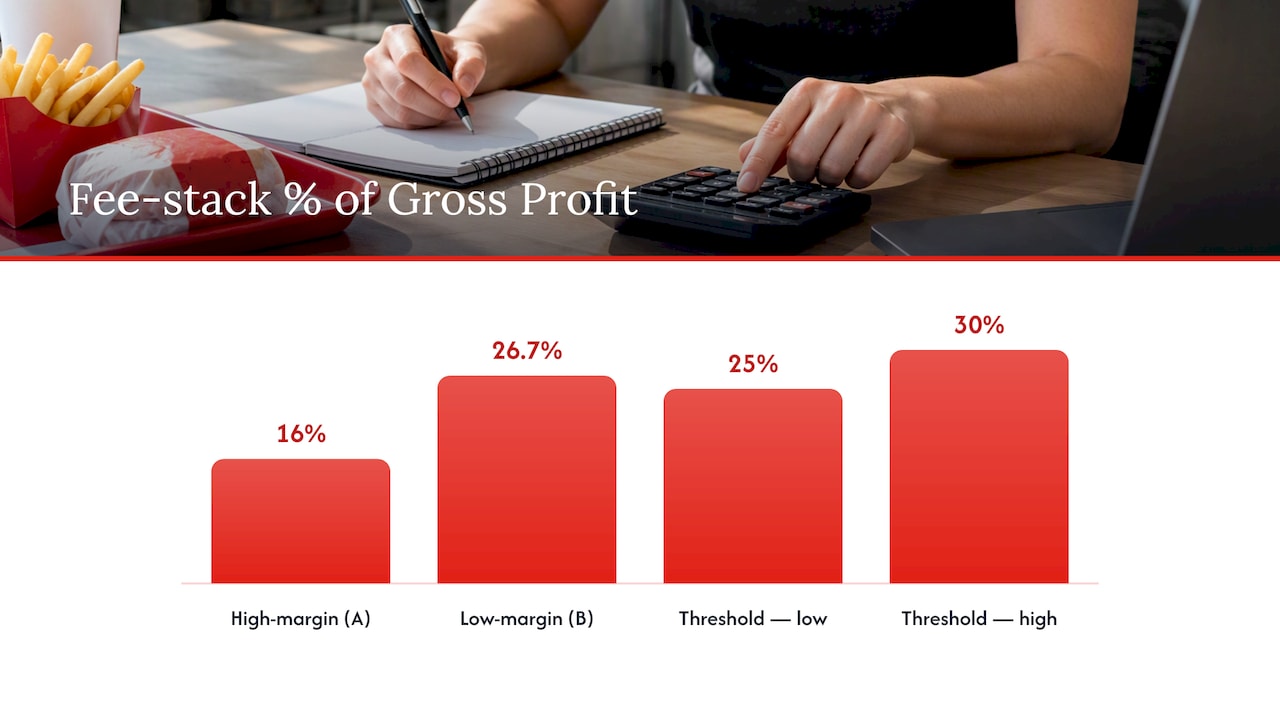
- Combined fee stack burden: $80,000, or 16% of gross profit.
- Remaining gross profit before rent and labor: $420,000.
Example B: low-gross-margin retailer. Assume the same — revenue and identical 5% royalty plus 3% advertising fund, but a 30% gross margin instead of 50%.
- Gross profit: — times 30% equals $300,000.
- Royalty burden: still $50,000.
- Advertising fund burden: still $30,000.
- Combined fee stack burden: $80,000, now 26.7% of gross profit.
- Remaining gross profit before rent and labor: $220,000.
The dollar burden is identical in both examples, $80,000, because royalties are calculated against revenue, not margin. This is the mechanical reason the same royalty percentage can be comfortable for one category and dangerous for another.
Sensitivity checks sharpen the picture further. A practical rule of thumb, drawn from margin benchmarks used across retail and restaurant analysis, is that once the fee stack consumes more than roughly 25% to 30% of gross profit, operating margin risk becomes elevated and rent plus labor have very little room left to absorb.
The fee stack and what to negotiate before signing
The total fee stack, not any single line item, determines whether a unit can clear rent, labor, and a reasonable owner return. Comparing offers requires adding every recurring percentage and flat fee together before judging which deal is actually cheaper.
A few levers are worth raising during negotiation, particularly for multi-unit or area-development discussions:
- Tiered royalty structures that step down slightly as a unit or operator crosses volume thresholds.
- Advertising fund transparency, including audited statements showing how the pooled fund is spent.
- Technology fee caps that prevent platform costs from scaling faster than unit revenue.
- Early-term discounts on royalty rates during a ramp-up period, often the first 12 to 24 months.
Pro Tip: Score competing offers by combining every recurring fee into a single effective percentage of revenue before comparing royalty rates in isolation, since a lower headline rate can still carry a higher total burden.
A compact scoring checklist helps keep the comparison objective: total fee stack as a percentage of projected revenue, disclosed Item 19 performance data quality, advertising fund audit history, and the franchisor’s responsiveness to franchisee requests for P&L detail. Weak answers on any of these points are worth more negotiating weight than a half-point difference in the base royalty.
Why franchisor royalty revenue looks different from store margins
Royalty revenue is attractive to franchisors precisely because it carries almost no incremental cost once the franchise system is built. A franchisor that has already developed the brand, operating manual, and supply chain collects royalty dollars on top of sales it does not have to generate capital or labor for directly, which is why asset-light franchisors often report high incremental margins on royalty income even in periods of flat same-store sales.
- Royalty revenue scales with system-wide sales growth, not with any single store’s cost structure.
- Public filings typically disaggregate franchise royalty revenue, advertising fund revenue, and franchise rental income into separate line items, making it possible to see how each stream grows independently.
- A franchisor’s adjusted EBITDA margin on its franchise segment can look strong even in a year when individual franchisees are struggling with rising input costs or soft traffic.
This gap is the central warning for anyone evaluating a franchise opportunity from the outside. Strong, aggregated franchisor profitability, visible in segment-level reporting, does not guarantee that the typical unit is clearing an acceptable operating margin after its own royalty, rent, and labor costs. The two numbers answer different questions, and conflating them is one of the more common mistakes in quick evaluations of franchise economics.
Reading SEC and FDD data: a public-filing example
Public company filings are useful teaching tools for understanding how royalty revenue is reported, even for readers who will never buy into that specific brand. Wendy’s 2025 SEC segment disclosures list franchise royalty revenue and advertising fund collections as separate line items within its segment tables, reporting several hundred million dollars in franchise royalty revenue alongside significant advertising fund collections for the period. That kind of disaggregation is exactly what a careful reader should look for in any 10-K covering a franchised restaurant or retail system.
The items worth extracting from a segment table or FDD are consistent across brands:
- Franchise royalty revenue, reported separately from company-operated restaurant revenue.
- Advertising fund revenue and receipts, which should roughly track system-wide sales if the fund is being collected as agreed.
- Number of franchised units, used to calculate average royalty revenue per unit as a rough proxy for system health.
- Deferred franchise fees, which signal how much upfront fee revenue is being recognized over time rather than booked immediately.
Item 19 alone can mask store-level unprofitability, which is why due-diligence guides consistently recommend supplementing it with direct franchisee interviews and independent P&L reconciliation.
Readers working through Wendy’s own disclosures in more depth can find a fuller breakdown in this review of Wendy’s franchise fee structure, which connects the filing data back to investor-facing implications.
A due diligence checklist for verifying royalty claims
Verifying royalty claims and unit economics takes more than reading Item 19 once. A short, repeatable process catches most of the gaps between advertised performance and real store-level results.
- Request the FDD Item 19 financial performance representation along with the methodology behind any averages or medians it reports.
- Ask for historical P&Ls from a sample of existing units, not just system-wide averages.
- Review lease abstracts and vendor contracts to confirm rent and cost-of-goods assumptions used in any pro forma.
- Obtain capex schedules covering both initial build-out and any mandated remodel cycles.
- Calculate AUV, gross margin percentage, royalty burden as a percentage of gross profit, and break-even sales using the unit’s own numbers rather than system averages.
- Interview current franchisees directly, asking specifically about unreported recurring costs, local marketing obligations beyond the ad fund, and how often royalty remittance timing has created cash flow strain.
The U.S. Small Business Administration’s guidance on franchise fees is a useful starting reference for understanding what franchisors are required to disclose and what questions are reasonable to ask before signing.
Balancing royalty costs against support and fit
Royalties deserve to be judged against a model built on the unit’s own AUV and gross margin, never against the royalty percentage alone.
Higher royalties are worth accepting when the franchisor can show, with real data rather than promotional language, that its marketing fund and brand reach are driving traffic the operator could not generate independently. They are not worth accepting when Item 19 is absent, when franchisee interviews reveal costs the FDD does not mention, or when the fee stack already consumes more than roughly a quarter of gross profit before rent and labor are considered. The honest answer is almost always in the worked math, not in the pitch.
— Benjamin
BuyWendy’s resources for modeling franchise economics
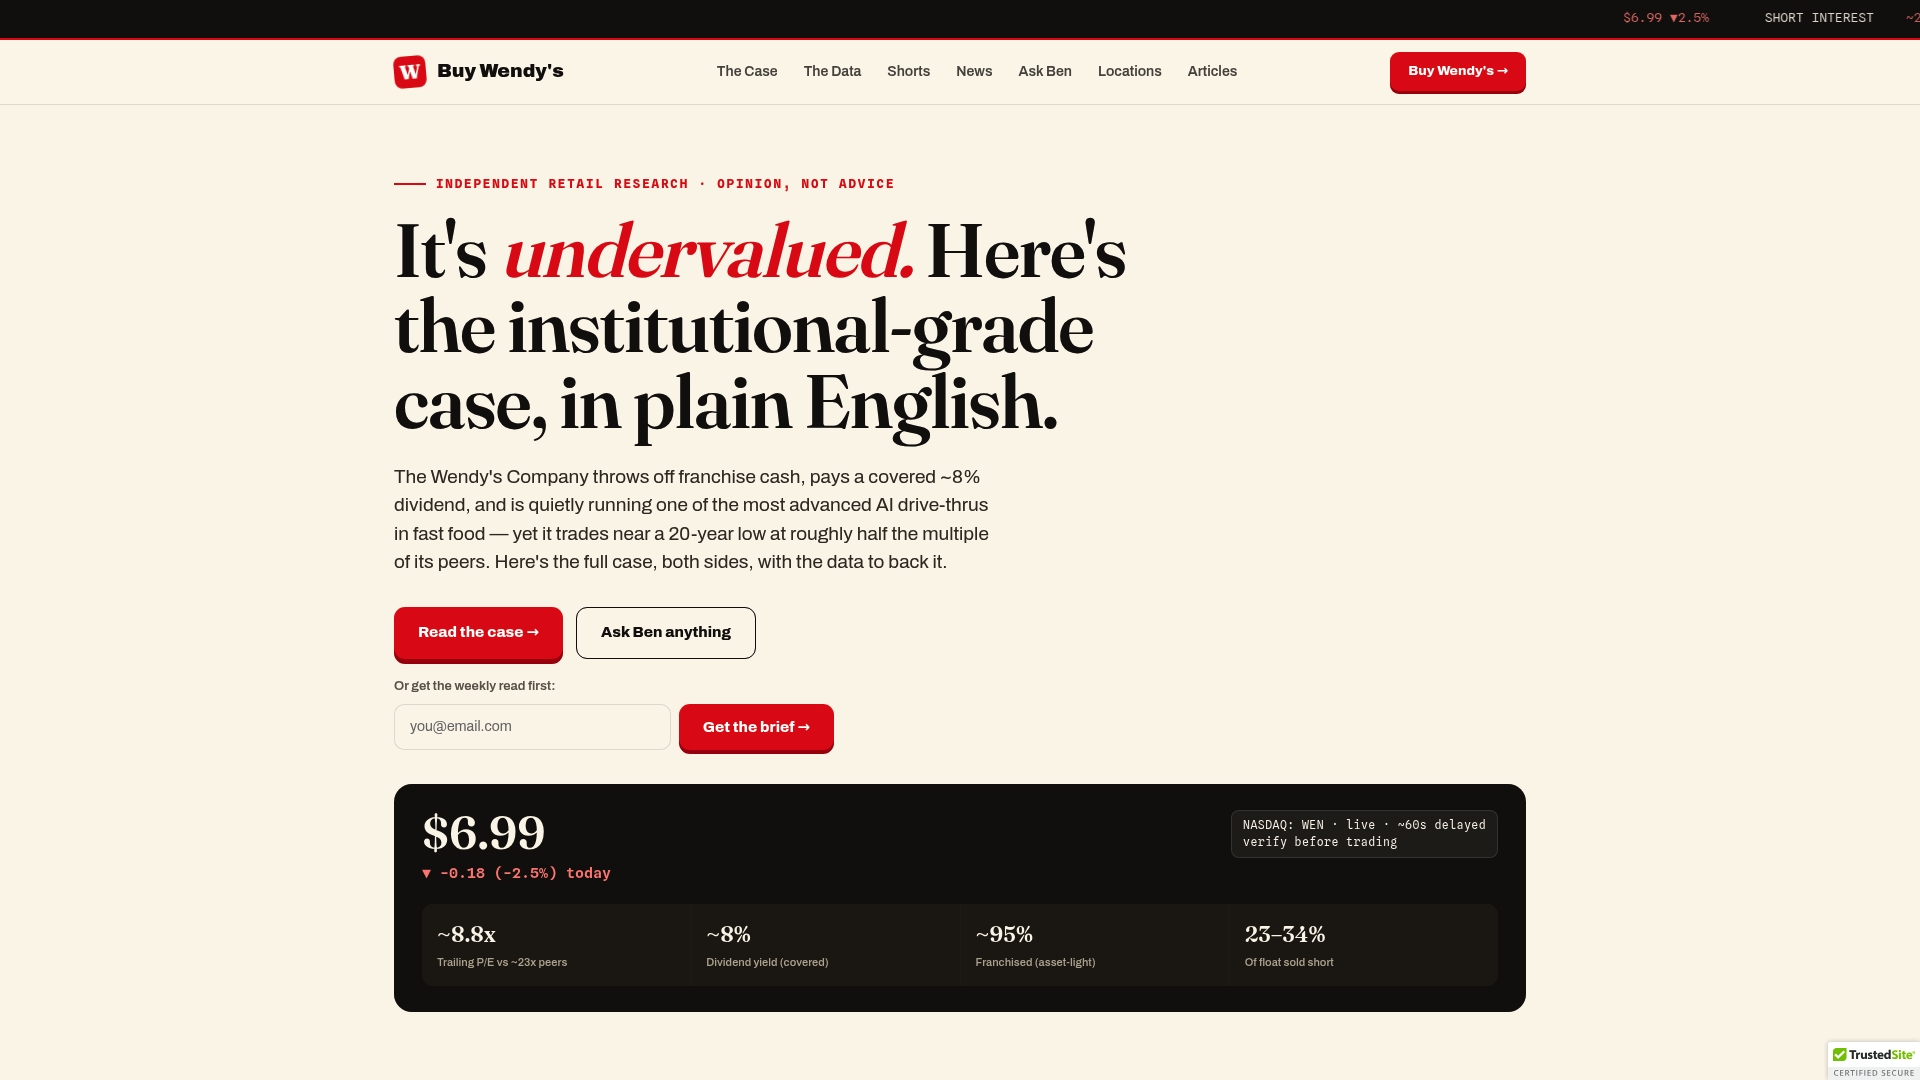
Running this kind of fee-stack math against a real, publicly traded franchise system is easier with primary disclosures already organized. BuyWendy’s covers Wendy’s franchise economics specifically, using the company’s own SEC filings and FDD data as the backbone of its analysis rather than generic industry averages.
A few resources are directly useful for applying the math in this article to a real system:
- The asset-light franchise model guide explains how royalty and rent income scale for a franchisor with minimal direct operating costs.
- The restaurant royalty model breakdown walks through royalty structure variants and what they imply for investors evaluating franchised systems.
- The Wendy’s franchise cost and economics guide applies Item 19 interpretation directly to Wendy’s own FDD.
For a current view of how these dynamics show up in the stock itself, the Wendy’s stock bull vs bear case lays out both sides using the same public-filing approach covered here.
Primary sources and recommended reading
The claims and figures in this article trace back to a small set of primary and industry sources worth reading directly:
- Wendy’s 2025 SEC segment disclosures: the primary filing example used to show how franchise royalty revenue and advertising fund collections appear in segment reporting.
- NetSuite’s retail profit margin guide: source for current Item 19 disclosure rates among franchisors.
- Academic comparison of margin-based and sales-based royalties: the modeling basis for how royalty structure changes channel incentives.
- Shopify’s profit margin benchmarks: the retail and restaurant margin ranges used in the worked examples.
- SBA’s franchise fee guidance: a plain-language reference for what franchise fees cover and what to review before signing.
This article is general information, not a substitute for advice from a qualified financial advisor. Consult a qualified financial professional about your own circumstances before acting on anything here.
Sources
- Wendy’s 2025 filings (SEC R9.htm)
- NetSuite: Retail profit margins (article page)
- ScienceDirect: Comparative analysis of margin-based and sales-based royalties
- Shopify: What is a good profit margin? (2026)
FAQ
Are royalties paid on profit or revenue?
Royalties are almost always calculated as a percentage of gross sales, not profit, which means they are owed whether the store is profitable that period or not. Margin-based royalty structures exist and are used in some perishable-goods or specialty categories, but sales-based royalties dominate most franchise systems because they are simpler to verify from point-of-sale data.
What is a 10% royalty in business?
On — in annual revenue, a 10% royalty amounts to $100,000 paid to the franchisor, a figure that must be modeled against the store’s own gross margin to understand its real impact.
What are the disadvantages of royalties?
Royalties are a fixed deduction from revenue that does not flex downward when a store’s sales are soft or its margins compress, which can turn a slow period into a loss. Combining the royalty with advertising fund and technology fees often pushes the total fee stack well above the headline royalty rate alone, catching operators who evaluated only the base percentage.
What does royalty revenue mean?
Royalty revenue is the income a franchisor collects from franchisees as a percentage of their gross sales, reported separately from company-operated store revenue in most public filings. It is attractive to franchisors because it scales with system-wide sales growth while carrying very little incremental cost, which is visible in how Wendy’s segment disclosures separate franchise royalty revenue from other revenue streams.