
A restaurant royalty model is a recurring payment, usually a percentage of gross sales, that a franchisee pays the franchisor for continued use of the brand, systems, and support. For investors, this structure converts an operationally volatile business, restaurants, into a contractually enforced revenue stream that behaves more like rent than retail profit.
That distinction drives the entire fast-food investment thesis. The FTC Franchise Rule requires franchisors to disclose these ongoing fees in Item 6 of the Franchise Disclosure Document, giving analysts a standardized way to compare systems. Industry benchmarks compiled by FranchiseIQ put quick-service royalty rates in a fairly narrow band, but the headline number rarely tells the full story once ad funds and technology fees stack on top.
What this means for your model:
- Royalty revenue is recurring and largely insulated from single-store underperformance.
- Margins on royalty income run high because franchisors carry almost none of the labor or food cost.
- Sensitivity to system-wide average unit volume (AUV) matters more than sensitivity to any one location.
- Fee stacking, not the royalty rate alone, determines whether franchisees stay solvent enough to keep paying.
Key Takeaways
Restaurant royalty models turn a percentage of franchisee gross sales into predictable, high-margin franchisor revenue, but the true investor risk lives in fee stacking, not the headline rate.
| Point | Details |
|---|---|
| Royalty is one line, not the whole cost | Ad funds, tech fees, and local minimums often push total fee burden well above the headline royalty rate. |
| Check Item 6 and Item 11 together | Item 6 discloses fees; Item 11 shows what those fees are supposed to fund in franchisor support. |
| Watch the 8% threshold | Royalty rates above roughly 8% in thin-margin sectors are a documented caution signal for franchisee viability. |
| Model effective margin, not store margin | Subtract royalty and ad fund rates from store-level margin before calculating payback and cash-on-cash returns. |
| International royalties carry extra risk | Master franchise structures and currency exposure make foreign royalty streams less transparent than domestic ones. |
Table of Contents
- How the Restaurant Royalty Model Actually Works
- What Does the FTC Franchise Rule Require Franchisors to Disclose?
- What Are Normal Royalty Benchmarks and Red Flags for Investors?
- One-Page Checklist for Diligence on Franchise Royalty Structures
- How Do You Model Royalty Revenue for Valuation Purposes?
- What Does Wendy’s Royalty and Rent Model Show Investors?
- How Are Royalty Payments Taxed for Franchisors and Franchisees?
- How Do Royalty Models Change When Franchising Internationally?
- An Investor’s Take on Royalty-Driven Revenue
- Primary Sources for Modeling Royalty Structures
- Frequently Asked Questions
- Sources
How the Restaurant Royalty Model Actually Works
Most restaurant royalty models charge a fixed percentage of gross sales, typically collected weekly or monthly through automated bank drafts tied to point-of-sale reporting. A minority of systems use tiered rates that decline as volume rises, or flat minimum royalties that kick in when a location underperforms. The FDD’s Item 6 disclosure frames royalties as one line in a broader fee structure that franchisors design to fund brand support, purchasing power, and technology.
The royalty rarely travels alone. Franchise agreements typically layer in:
- A national or system-wide advertising fund contribution, often separate from the royalty itself.
- Local advertising minimums that franchisees must spend regardless of the national fund.
- Technology or point-of-sale platform fees, increasingly mandatory as chains roll out digital ordering and AI-driven drive-thru systems.
- Minimum royalty floors that apply even when gross sales fall short of projections.
Here’s a simplified flow: a location generates $1.8 million in annual gross sales.
What Does the FTC Franchise Rule Require Franchisors to Disclose?
The FTC Franchise Rule requires every franchisor to disclose ongoing fees in Item 6 of the FDD before a prospective franchisee signs anything. For analysts, Item 6 is the fastest way to reconstruct a franchisor’s recurring revenue mechanics without waiting for a 10-K footnote.
Reading Item 6 well means separating percentage-of-sales fees from flat fees, then checking for escalation clauses that let a franchisor raise royalties over the life of the agreement. Watch for language describing rates “as determined by franchisor,” which signals discretionary pricing power that a static percentage disclosure won’t capture.
Pro Tip: Cross-reference Item 6 with Item 11, which lists the franchisor’s contractual support obligations. A royalty only earns its keep if Item 11 shows real marketing, training, and technology commitments funded by that fee.
What Are Normal Royalty Benchmarks and Red Flags for Investors?
Quick-service royalty rates typically fall in the 4% to 6% range, with advertising fund contributions adding another 1% to 4%, according to FranchiseIQ’s sector benchmarks.
The gap between the headline rate and the real cost is where most investors get surprised. FranchiseVS’s analysis shows that fee stacking, royalty plus ad fund plus tech fees plus local requirements, commonly pushes total ongoing fee burden to roughly 8% to 13% of gross revenue in many systems.
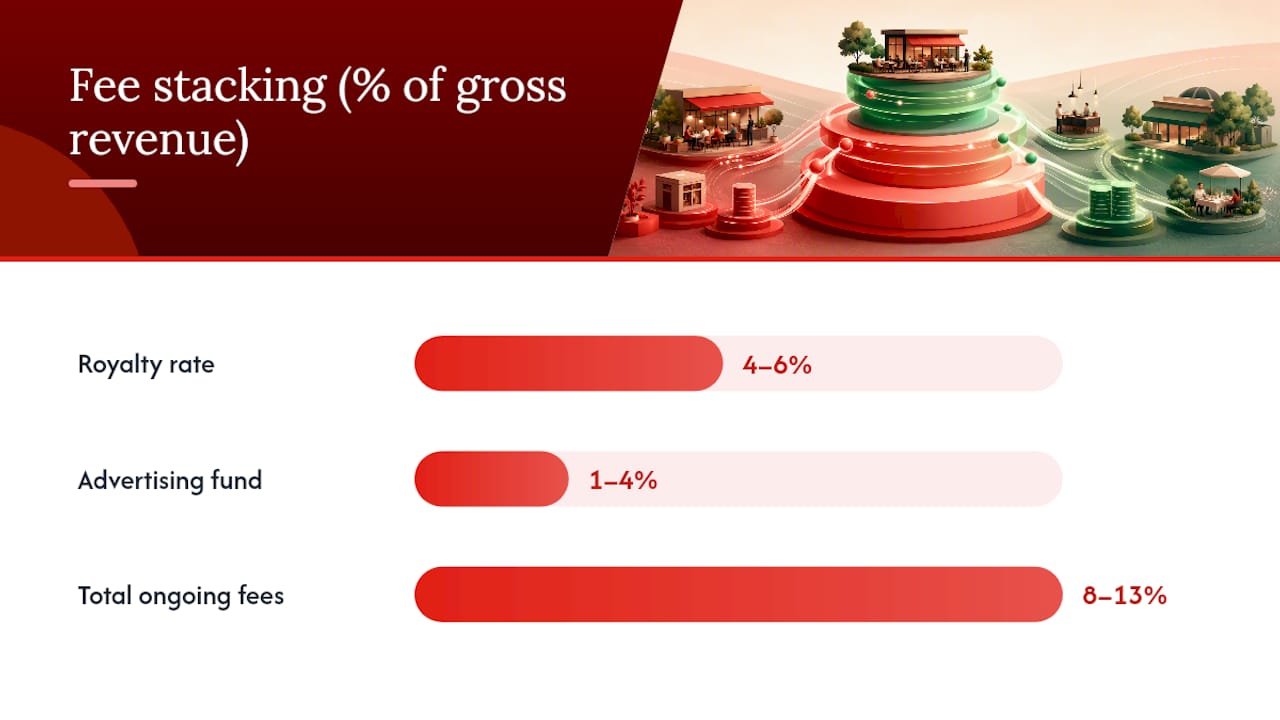
That gap matters directly to unit-level EBITDA.
Watch for these warning signs when evaluating a system:
- A royalty rate above roughly 8% in a sector where margins are already thin, a level FranchiseIQ flags as a caution point.
- Minimum royalty clauses that require payment even when sales collapse.
- Escalation language permitting uncapped or frequent rate increases.
- Mandatory vendor programs or supplier markups that function as shadow royalties, quietly inflating the franchisor’s real take beyond the disclosed percentage.
One-Page Checklist for Diligence on Franchise Royalty Structures
Before modeling any franchised restaurant company, confirm these items directly from the FDD and franchise agreement:
- Item 6 fee lines, separating percentage fees from flat and minimum fees.
- Item 11 deliverables, matching franchisor obligations to what the royalty actually funds.
- Item 19 median AUV, the backbone of any royalty revenue projection.
- Item 20 franchisee turnover and retention data, a proxy for system health.
- Historical fee increases and whether escalation clauses have caps.
- Vendor program language that could function as an undisclosed markup.
Run three quick formulas during initial screening: total fee stack as a percentage of gross revenue, fee stack as a percentage of unit-level EBITDA, and the revenue uplift a location needs just to offset its fee burden.
Pro Tip: Multi-unit developers and conversion franchisees, operators switching an existing restaurant to a new brand, typically win the best concessions: ramped royalty schedules, temporary caps, or waived minimums during a location’s first one to two years.
How Do You Model Royalty Revenue for Valuation Purposes?
Franchisor royalty revenue starts with a simple formula: average unit volume multiplied by the royalty rate multiplied by the number of units, adjusted for any ramp-up periods where new franchisees pay reduced rates. The Franchise Architect’s unit economics framework recommends calculating effective margin as store-level margin minus royalty and ad fund rate, then building payback and cash-on-cash returns from that adjusted figure rather than headline store margin.
Sensitivity testing should move three levers independently:
- Royalty rate. A one-point increase in royalty rate, from 4% to 5%, can shave a full percentage point off franchisee free cash flow at the unit level, tightening payback by several months.
- System AUV. A downside scenario with AUV 10% below system median compresses both franchisor royalty collections and franchisee margin simultaneously, since the fee stack takes an unchanged percentage of a smaller base.
- Fee stacking creep. Multi-year models should stress-test gradually rising technology and ad-fund obligations, since franchisors routinely add mandatory platforms over the life of an agreement.
One modeling subtlety trips up newer analysts: ad fund contributions are often pass-through, not franchisor revenue, since franchisors typically spend that money on system-wide marketing rather than keeping it. Technology fees, by contrast, frequently land as franchisor revenue outright. And any required vendor rebate program should be modeled as a COGS adjustment, a shadow royalty, rather than ignored entirely.
What Does Wendy’s Royalty and Rent Model Show Investors?
Wendy’s operates a franchise-heavy model where royalty and rent income, not restaurant-level food sales, drive the bulk of corporate revenue stability. That structure is precisely why McDonald’s parallel approach has made heavily franchised QSR chains attractive to long-term investors: royalties and rents produce predictable, high-margin income streams largely detached from day-to-day restaurant execution.
Illustratively, if a Wendy’s franchise location generates AUV near system average and pays a royalty in the mid-single-digit percentage range, that single unit contributes a modest but highly reliable annual sum to corporate royalty revenue, compounding across thousands of units into a stable base largely insulated from any one location’s bad quarter.
- Royalty income scales with system-wide sales, not company-operated store performance.
- Rental income, where Wendy’s owns or leases the underlying real estate to franchisees, adds a second, distinct recurring stream.
- Together, these streams reduce Wendy’s earnings exposure to labor costs, food inflation, and other line items that squeeze restaurant-level margins.
Franchise royalty and rent income shift risk away from daily operations and toward long-term system health, meaning the investor case for a company like Wendy’s hinges more on unit count and AUV trends than on any single quarter’s restaurant-level results.
Buywendys tracks these dynamics in Wendy’s franchise cost and economics analysis, which walks through what the FDD actually discloses about franchisee-level fees and support.
How Are Royalty Payments Taxed for Franchisors and Franchisees?
Franchisors generally treat royalty income as ordinary business revenue, taxed at standard corporate rates, and recognize it as earned when the underlying franchisee sales occur rather than when cash arrives, depending on accounting method. Franchisees, meanwhile, typically deduct royalty payments as an ordinary and necessary business expense, reducing taxable income in the year the fee accrues.
The tax treatment gets more complex around the initial franchise fee versus ongoing royalties. Initial fees often must be capitalized and amortized over the life of the franchise agreement rather than deducted immediately, while ongoing royalty payments tied to gross sales are usually expensed as incurred. This distinction matters for cash-flow modeling because it affects the timing of tax benefits a franchisee can claim, which in turn shapes early-year free cash flow projections analysts use in payback calculations.
For franchisors structured as pass-through entities, royalty income flows to owners’ personal returns, while corporate franchisors like publicly traded chains report royalty revenue on consolidated financial statements subject to standard corporate tax rules. Cross-border royalty payments introduce withholding tax considerations, since a domestic franchisor collecting royalties from an international franchisee may face treaty-dependent withholding rates that reduce net royalty receipts.
Investors modeling franchisor cash flow should treat royalty revenue as pre-tax income subject to standard corporate rates, then apply the franchisor’s effective tax rate, factoring in any state-level variation, to project after-tax free cash flow available for dividends or buybacks.
How Do Royalty Models Change When Franchising Internationally?
Restaurant royalty models shift meaningfully once a franchisor expands beyond domestic borders. Master franchise agreements, common in international expansion, often replace direct franchisor-to-franchisee royalty collection with a master franchisee who pays a reduced royalty to the parent company while collecting a full royalty from sub-franchisees in that territory. This structure dilutes the parent franchisor’s direct royalty percentage but expands total addressable units without requiring direct operational oversight.

Currency risk becomes a real modeling variable. Royalties denominated in local currency and converted back to U.S. dollars expose franchisor revenue to exchange rate fluctuation, meaning a stable royalty percentage abroad can still produce volatile reported revenue at the consolidated level.
Regulatory disclosure requirements also vary by country. The FTC Franchise Rule and its Item 6 disclosure apply specifically to U.S. franchise offerings; international jurisdictions maintain their own disclosure frameworks, some far less standardized, which means analysts evaluating a chain’s international royalty stream often have less transparent data to work with than domestic FDD filings provide.
Finally, local market royalty rates sometimes differ from domestic benchmarks to account for lower AUVs, different competitive intensity, or master franchisee negotiating leverage. Investors should treat international royalty contribution as a distinct, less transparent revenue segment rather than assuming it mirrors domestic fee structures.
An Investor’s Take on Royalty-Driven Revenue
Royalty-driven revenue deserves a premium valuation multiple over restaurant-level operating margins because it carries contractual predictability that store-level P&Ls simply don’t offer. The caveat: that predictability only holds when system AUVs stay stable, disclosure fidelity is high, and royalty escalation language doesn’t quietly erode franchisee economics.
Primary Sources for Modeling Royalty Structures
For franchise disclosure guidance, review Franchise Grade’s royalty and profitability breakdown and FranchiseIQ’s sector benchmark report. For unit economics formulas, see The Franchise Architect’s modeling guide.
For applied Wendy’s analysis, Buywendys offers a franchise cost and economics deep dive and a QSR profitability metrics guide covering AUV and margin benchmarks used throughout this analysis. Readers modeling royalty revenue against Wendy’s technology investments can also review Buywendys’ restaurant AI trends coverage, and franchisees exploring payment technology relevant to fee structures can reference RESTOBOT’s QR payment infrastructure.
For readers ready to apply this framework to Wendy’s own valuation, Buywendys’ stock valuation model guide walks through the inputs, including royalty and rent assumptions, used to build a full investment case.
Frequently Asked Questions
What is a typical royalty rate in a restaurant franchise agreement?
Quick-service royalty rates typically run 4% to 6% of gross sales, with advertising fund contributions adding another 1% to 4%, based on FranchiseIQ’s sector benchmarks.
Is a restaurant royalty model based on gross sales or net sales?
Nearly all restaurant royalty structures use gross sales rather than net profit, meaning franchisees owe the fee regardless of unit-level profitability.
What is considered a red flag in a franchise royalty structure?
Why do investors favor heavily franchised restaurant companies?
Franchised revenue from royalties and rent is recurring and high-margin, shifting operational risk to franchisees while giving the franchisor a more stable earnings base, a dynamic evident in both Wendy’s and McDonald’s business models.
Where can I find a restaurant chain’s actual royalty rate and fee structure?
Item 6 of the company’s Franchise Disclosure Document, required under the FTC Franchise Rule, lists all ongoing fees including royalty percentage, ad fund contributions, and minimum payments.
This article is general information, not a substitute for advice from a qualified financial advisor. Consult a qualified financial professional about your own circumstances before acting on anything here.
Sources
- How Royalties Impact Profitability: Wha… | Franchise Grade
- The Real Cost of Franchise Fees: Why 6% Royalty Actually Costs You 12% | FranchiseVS
- Franchise Royalty Fees by Industry: Benchmarks, Red Flags & What to Negotiate (2026) | FranchiseIQ
- Franchise Unit Economics: How to Run the Numbers Before You Sign | The Franchise Architect
- McDonald’s Business Model 2026: How 95% Franchising Works – FourWeekMBA