
Wendy’s cost base runs on three pillars: restaurant labor, food and paper, and occupancy and advertising expense. For investors, the number to watch isn’t restaurant-level cost of sales. It’s average unit volume (AUV) growth against a franchised royalty base that scales with almost no incremental capital.
TL;DR:
- Wendy’s restaurant labor costs are mainly driven by minimum wage laws, not menu pricing changes, and account for a significant portion of company-operated sales.
- Food and paper costs are highly volatile, influenced by commodity cycles such as beef and wheat prices, which impact margin fluctuations.
- The initial franchise investment varies widely depending on site type, construction, and equipment, with delays and contingencies often extending the buildout timeline.
- Franchisees pay fixed percentages of gross sales in royalties and advertising contributions, which scale directly with systemwide sales, not restaurant profitability.
- Wendy’s system growth relies more on increasing average unit volume than on expanding restaurant numbers, with cost structures signaling focus on technology and marketing investments.
Table of Contents
- What Makes Up Wendy’s Corporate Cost-of-Sales?
- How Much Does It Cost to Open a Wendy’s Franchise?
- What Ongoing Fees Do Wendy’s Franchisees Pay?
- How Do You Calculate Wendy’s Unit Economics?
- Does Wendy’s Dynamic Pricing Actually Raise Prices?
- How Do You Pull Cost Inputs From SEC Filings and the FDD?
- What Wendy’s Cost Structure Signals for Investors
- Tools for Modeling Wendy’s Franchise and Stock Economics
- Where to Verify the Numbers
- Sources
What Makes Up Wendy’s Corporate Cost-of-Sales?
Wendy’s reports cost-of-sales primarily against its U.S. company-operated restaurants, and the line breaks into three familiar buckets: restaurant labor, food and paper, and occupancy, advertising, and other operating costs. Restaurant labor covers crew wages, benefits, and management pay at company-run locations. Food and paper tracks ingredient costs, packaging, and the commodity swings that make quarterly margins jump around. Occupancy and advertising fold in rent on company-owned real estate, utilities, and the contribution those restaurants make to the national advertising fund.
The U.S. segment’s cost of sales for full year 2024 came to $755.27 million, according to Wendy’s SEC filings. That figure sits almost entirely within the company-operated restaurant base rather than the franchised system, which is exactly why it tells you less about franchisee profitability than most first-time readers assume. Separately, advertising fund expenses reached approximately $441 million for the same year, a figure that runs through a dedicated fund rather than through Wendy’s core operating margin.
Here’s where it gets useful for modeling: adjusted EBITDA reconciliation strips out items that obscure the underlying trend. Depreciation and amortization, G&A allocations, and interest expense all sit below the operating line in the company’s reconciliation tables, and separating them from cost-of-sales is the difference between a clean unit-economics model and a distorted one. The company’s own segment reconciliation schedules walk through exactly how consolidated income ties back to segment adjusted EBITDA, and it’s worth pulling those tables directly rather than relying on a secondary aggregator.
| Cost Line | What It Includes | Reporting Level |
|---|---|---|
| Restaurant labor | Crew wages, benefits, management pay | Company-operated only |
| Food & paper | Ingredients, packaging, commodity exposure | Company-operated only |
| Occupancy, advertising & other | Rent, utilities, ad fund contributions | Company-operated only |
| G&A | Corporate overhead, shared services | Consolidated |
| D&A and interest | Depreciation, financing costs | Consolidated, reconciled out of adjusted EBITDA |
A few things stand out when you track this over multiple years using Statista’s historical cost-of-sales series:
- Labor cost as a share of company restaurant sales tends to move with minimum-wage legislation more than with menu pricing changes.
- Food and paper costs are the most volatile single line, swinging with beef and wheat commodity cycles.
- Advertising fund expense scales roughly with systemwide sales, since franchisees contribute a fixed percentage regardless of company-operated performance.
- G&A has grown more slowly than revenue in recent years, a trend management ties to the technology-driven efficiency push under Project Fresh.
How Much Does It Cost to Open a Wendy’s Franchise?
The upfront capital commitment for a new Wendy’s franchise is a range, not a single number, and the spread is wide enough to change your return calculation significantly. The Franchise Disclosure Document’s Item 7 breaks the total initial investment into distinct categories that prospective owners need to budget individually rather than treat as one lump sum.
The major line items typically include:
- Initial franchise fee: a fixed upfront payment to Wendy’s for the license and territory rights.
- Site construction and buildout: land improvements, building shell, and interior finish work, which varies enormously by market and whether the site is new construction or a conversion.
- Kitchen equipment: fryers, grills, refrigeration, and the digital menu board hardware increasingly standard across the system.
- Signage and exterior branding: pylon signs, drive-thru canopy branding, and lighting.
- Point-of-sale and technology systems: registers, kitchen display systems, and the infrastructure that supports mobile ordering.
- Opening inventory and initial working capital: food stock, supplies, and a cash cushion to cover the first months of operation before cash flow stabilizes.
- Training and pre-opening labor: staffing costs incurred before the doors open.
Total initial investment ranges vary by market, site type, and whether the franchisee is building new or converting an existing restaurant. Buywendys breaks down the full FDD-based investment range with Item 7 line-item detail for readers who want the granular figures rather than a summary.
Financing timelines matter as much as the dollar figures. Construction delays, permitting bottlenecks, and equipment lead times routinely push the gap between signing a franchise agreement and opening day past initial projections. Prospective owners should budget a contingency reserve on top of the FDD estimate, since almost every real-world buildout runs over the low end of the published range.
What Ongoing Fees Do Wendy’s Franchisees Pay?
Once a restaurant opens, three recurring obligations shape franchisee cash flow every month: royalties, rent (where applicable), and advertising fund contributions. Understanding how each is calculated, and how it flows through corporate reporting, is essential for anyone modeling either franchisee returns or Wendy’s consolidated financials.
- Royalty payments. Franchisees pay Wendy’s a percentage of gross sales, calculated and remitted on a recurring basis regardless of restaurant profitability. This is the single most predictable revenue stream in the entire business model, which is exactly why franchised royalty income trades at a premium to volatile company-operated margins.
- Rent, where Wendy’s owns or subleases the real estate. Many locations operate under percentage rent structures, where the landlord (sometimes Wendy’s itself) collects a base rent plus a share of sales above a threshold, along with common area maintenance (CAM) charges for shared property upkeep.
- Advertising fund contributions. Franchisees contribute a fixed percentage of gross sales into the national advertising fund, which pools marketing spend across the system. Surpluses or deficits in this fund show up in corporate reporting as a distinct line, separate from operating cost of sales.
Pro Tip: When you’re modeling franchisee cash flow, don’t net advertising fund contributions against royalty income. They’re accounted for separately, and the fund itself can run a timing deficit that shows up as a working capital swing on the corporate balance sheet rather than as an operating expense.
Investors should model royalty and advertising rates as a combined percent-of-sales bundle when forecasting systemwide revenue, since both scale directly with the same systemwide sales figure management uses in its guidance.
How Do You Calculate Wendy’s Unit Economics?
Converting Wendy’s public disclosures into a usable per-unit model means keeping four metrics straight: AUV, restaurant margin, company-operated margin, and segment adjusted EBITDA. Conflating them is the most common mistake among first-time readers of restaurant financials.
AUV (average unit volume) measures average annual sales per restaurant across the system, franchised and company-operated combined. Restaurant margin measures profitability at the individual restaurant level, sales minus restaurant-level operating costs, before any corporate overhead allocation. Company-operated margin applies that same math specifically to the subset of restaurants Wendy’s owns directly. Segment adjusted EBITDA is the broadest measure, capturing royalty income, rental income, and company-restaurant profit, reconciled to exclude depreciation, certain G&A items, and one-time charges.
Here’s a simplified version of how the pieces connect, using the reported 2024 figures as a starting point:
| Metric | Approximate Basis | What It Tells You |
|---|---|---|
| U.S. segment cost of sales | $755.27 million (2024) | Company-operated restaurant cost base |
| Advertising fund expense | approximately $441 million (2024) | Systemwide marketing spend, separate from operating margin |
| Systemwide sales growth target | a targeted mid-single-digit annual growth | Management’s long-term algorithm for AUV-driven expansion |
| Net unit growth target | a targeted mid-single-digit annual growth | Franchise development pace underlying royalty growth |
Start with systemwide sales, apply the royalty rate to estimate gross royalty income, then layer in rental income from any properties Wendy’s subleases to franchisees. Subtract corporate G&A and the reconciling items noted in the segment tables, and you arrive at an adjusted EBITDA figure that’s far more representative of true earning power than restaurant-level cost of sales alone. Management’s 2025 Investor Day guidance targets 3 to 4% annual net unit growth alongside 5 to 6% systemwide sales growth, a combination meant to compound adjusted EBITDA growth faster than either metric alone would suggest.
The sensitivities that matter most: labor inflation compresses company-operated margin directly, commodity price swings hit food and paper costs with a lag, and advertising fund timing can distort quarter-to-quarter comparisons even when underlying trends are stable. A fuller version of this reconciliation is available in the quarterly earnings breakdown.
Does Wendy’s Dynamic Pricing Actually Raise Prices?
Wendy’s dynamic pricing model is a demand-smoothing tool, not a surge-pricing mechanism. The company has publicly clarified that digital menu boards will be used to offer discounts during slower dayparts rather than to raise prices during breakfast or dinner rushes, a distinction Northeastern’s reporting highlighted after early coverage mischaracterized the initiative as surge pricing similar to ride-share apps.
For modeling purposes, the operational benefits run in a consistent direction: better demand distribution across dayparts, lower food waste from more predictable throughput, and improved labor scheduling efficiency during traditionally slow periods.
Key assumptions to build into any sensitivity model:
- Customer pushback risk is real and could slow adoption if perceived as opportunistic pricing rather than discounting.
- Franchisee autonomy matters. Adoption isn’t uniform, and rollout pace varies by market and franchisee technology investment.
- Implementation timelines extend past initial announcements as digital menu board hardware rolls out unevenly across the system.
The direction of the margin impact favors modest improvement in labor utilization and waste reduction, though the magnitude remains difficult to quantify until more systemwide adoption data becomes available.
How Do You Pull Cost Inputs From SEC Filings and the FDD?
Building a defensible cost model means going to primary sources rather than secondary summaries, and the process follows a repeatable sequence.
- Start with the 10-K’s segment footnotes. These tables break out U.S. segment revenue, cost of sales, and advertising fund activity separately from consolidated totals.
- Pull the adjusted EBITDA reconciliation table. This shows exactly which items (D&A, stock compensation, one-time charges) get added back to reach the adjusted figure management highlights in earnings calls.
- Cross-reference the 10-Q for the most recent quarter. Annual figures smooth out seasonality that quarterly data reveals, particularly around advertising fund timing.
- Open the FDD’s Item 7. This is where the itemized initial investment range lives, broken into the same categories any franchise attorney would recognize: franchise fee, real estate, construction, equipment, and working capital.
- Build a three-scenario sensitivity table. Use conservative, base, and aggressive assumptions for labor cost inflation and commodity pricing, then flex each against the AUV growth targets management has guided toward.
Pro Tip: Reconcile advertising fund timing separately from operating cash flow. A fund surplus in one quarter and deficit in the next can make free cash flow look more volatile than the underlying business actually is, a distinction worth building into any distributable cash flow model.
A worked example: take the reported U.S. segment cost of sales, divide by the estimated number of company-operated units, and you get a rough per-unit cost figure. Apply the same logic to advertising fund expense divided by systemwide unit count, and you isolate the marketing cost burden per restaurant regardless of ownership structure. This walkthrough is applied in a guide to calculating free cash flow, including how to treat advertising fund swings as a distinct adjustment.
What Wendy’s Cost Structure Signals for Investors
A franchised system shifts capital risk onto franchisees while concentrating investor returns in royalty and rent streams tied to systemwide AUV growth, not restaurant-level margins. That’s why Project Fresh’s reallocation of capital away from Build-to-Suit expansion toward technology and marketing investment matters more than a casual reading suggests. It’s a bet that AUV growth funded by digital tools compounds better than adding restaurant count alone. Watch three things over the next few quarters: AUV trend direction, whether the advertising fund runs consistent surpluses or deficits, and labor cost trajectory against wage legislation. Those three variables will tell you more about system health than any single quarter’s headline earnings number.
— Benjamin
Tools for Modeling Wendy’s Franchise and Stock Economics
Reading a segment table is one thing. Turning it into a defensible valuation or franchise underwriting model is another, and that gap is exactly where Buywendys focuses its work. Beyond this breakdown, Buywendys maintains a deeper walkthrough of FDD-based franchise costs for prospective owners underwriting a specific site, and a dedicated analysis of FreshAI’s operational impact for investors trying to quantify how drive-thru automation feeds into labor cost trends.
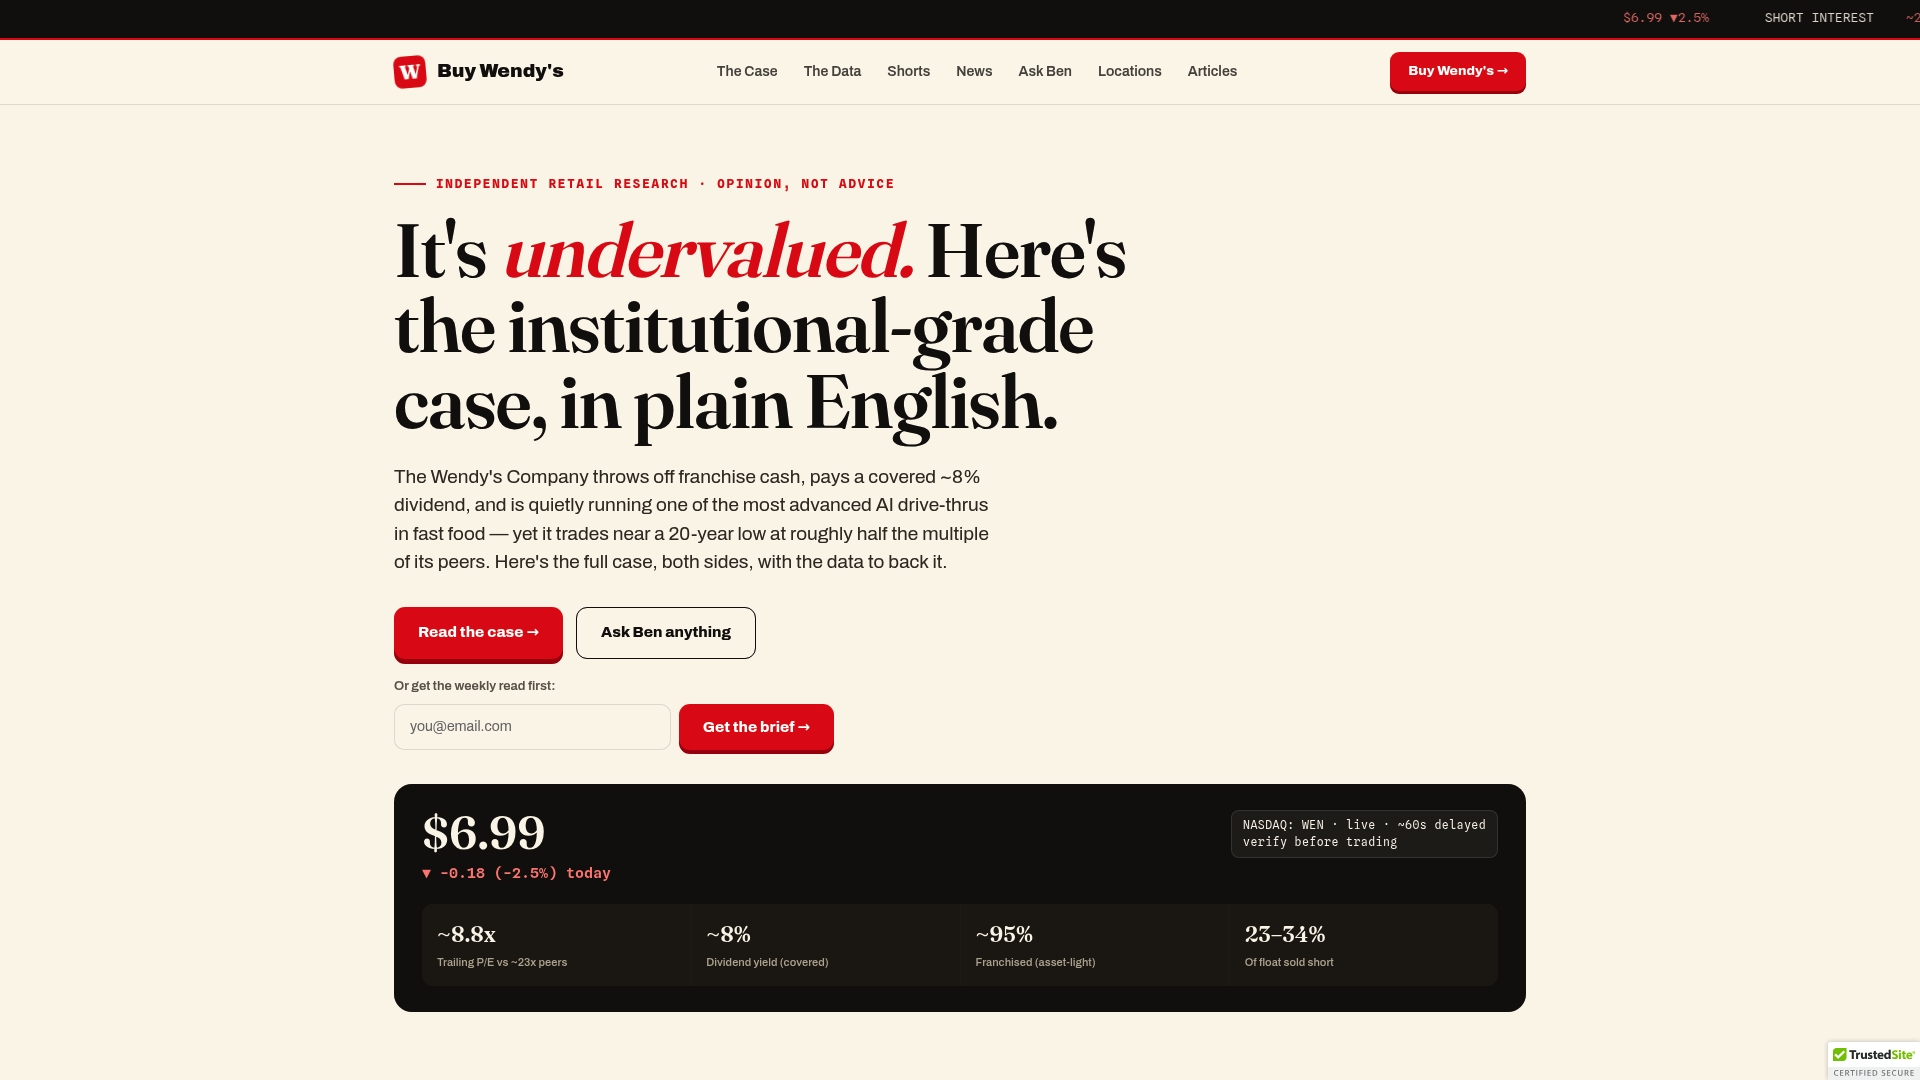
If you’re building a valuation model rather than a franchise budget, A restaurant stock analysis guide walks through the specific metrics that matter for WEN shares, from adjusted EBITDA multiples to dividend coverage ratios. None of this constitutes investment advice. It’s research designed to help you build your own model with the right inputs in the right places. Start with the segment breakdown above, then use that guide to pressure-test your assumptions against the metrics professional analysts actually track.
Where to Verify the Numbers
Every figure above traces back to Wendy’s 10-K/10-Q segment disclosures, the 2025 Investor Day materials, and Project Fresh press releases. These filings define non-GAAP measures like adjusted EBITDA in their own footnotes, and forward-looking statements carry the usual caveats about actual results differing from guidance.
This article is general information, not a substitute for advice from a qualified financial advisor. Consult a qualified financial professional about your own circumstances before acting on anything here.
Sources
- Wendy’s SEC filings — segment schedules (2024 disclosures)
- Wendy’s 2025 Investor Day — financial algorithm and growth targets
- How Wendy’s ‘Dynamic Pricing’ is Both Old News — and the Future (Northeastern news)