
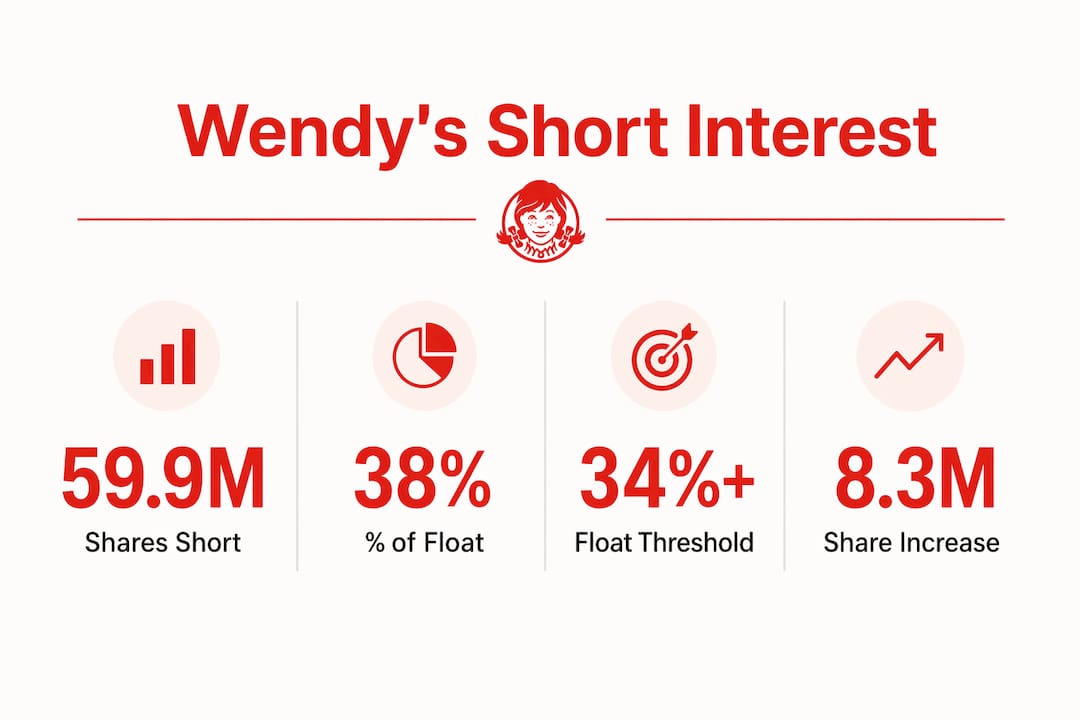
As of the June 30, 2026 settlement date, Wendy’s short interest stood at 59,995,000 shares, representing approximately 38% of the float with a days-to-cover ratio of 1.19, according to FINRA/Nasdaq bi-monthly reporting compiled by MarketBeat and ShortInterestHistory. Squeeze risk is currently rated medium-to-high: the float percentage is elevated and borrow fees spiked into double digits in late June 2026, but the sub-1.2 days-to-cover ratio means shorts can theoretically exit quickly at normal volume, which limits the mechanical squeeze window. The primary drivers to watch are borrow-fee stress and retail order flow, not the static short-interest print alone.
Statistic callout: 59,995,000 shares short, 37.99% of float, days-to-cover 1.19 — as of June 30, 2026 (FINRA settlement / MarketBeat).
Table of Contents
- What does Wendy’s short-interest data show right now?
- How has Wendy’s short interest trended over recent months?
- How does days-to-cover work, and what does WEN’s ratio actually mean?
- What mechanics drive a short squeeze, and where does Wendy’s stand?
- How can you track Wendy’s short interest and squeeze signals in real time?
- How does Wendy’s short interest compare with restaurant-sector peers?
- How do you score Wendy’s short-squeeze probability right now?
- What is the verdict on Wendy’s short-squeeze risk?
- Key Takeaways
- Why borrow fees matter more than the headline short-interest number
- Buywendys covers WEN short dynamics so you don’t have to start from scratch
- Useful sources for tracking Wendy’s short interest
What does Wendy’s short-interest data show right now?
The table below consolidates the key metrics from the June 30, 2026 settlement report. Each figure is sourced and timestamped; treat any cell without a date as a point-in-time snapshot that will shift with the next bi-monthly report.
| Metric | Value | Source / As-of Date |
|---|---|---|
| Shares sold short (absolute) | 59,995,000 | FINRA / Nasdaq, June 30, 2026 |
| Short percent of float | 37.99% | MarketBeat, June 30, 2026 |
| Days to cover (short-interest ratio) | 1.19 | ShortInterestHistory, June 30, 2026 |
| Avg. daily volume (used for days-to-cover) | ~50.4M shares | ShortInterestHistory, June 30, 2026 |
| Borrow fee (peak, late June 2026) | ~20% | ShortInterestTracker, July 1, 2026 |
| Shares available to borrow (trough) | ~9,000 | ShortInterestTracker, June 29, 2026 |
| Borrow fee (mid-July 2026 print) | ~4.28% | ShortInterestTracker, mid-July 2026 |
| Shares available to borrow (mid-July) | ~350,000 | ShortInterestTracker, mid-July 2026 |
Calculation note: The days-to-cover ratio equals reported shares short divided by average daily volume. ShortInterestHistory used the settlement-period average daily volume of approximately 50.4 million shares to derive the 1.19 figure. A different volume window (e.g., a 20-day trailing average at lower volume) would produce a materially higher ratio.
Key data-source notes:
- FINRA/Nasdaq settlement dates run on a bi-monthly cadence; the June 30, 2026 report was published approximately two weeks after the settlement date.
- MarketBeat’s WEN page aggregates FINRA figures and adds a short-interest ratio and historical chart.
- ShortInterestTracker publishes intraday borrow-fee and availability data, which updates more frequently than the bi-monthly FINRA print.
How has Wendy’s short interest trended over recent months?
The most significant development in the WEN short-interest record is the rapid accumulation between mid-May and end-June 2026. Short interest jumped from approximately 51.67 million to 59,995,000 shares between the June 15 and June 30 settlement dates, a net increase of about 8.3 million shares and an increase of roughly sixteen percent in a single reporting period. That is an unusually large single-period move for a mid-cap quick-service restaurant stock.
Statistic callout: +8.3 million shares added in a single two-week settlement window (+16.12%) — the largest single-period increase in the recent reporting history per ShortInterestHistory.
For context, earlier 2026 settlement data from Benzinga shows the trend building over several months:
- April 30, 2026 settlement: 46,292,209 shares short (34.08% of float), days-to-cover 6.26 at the then-prevailing volume.
- May 15, 2026 settlement: 50,725,039 shares short (37.34% of float), days-to-cover 3.05.
- May 29, 2026 settlement: 50,266,151 shares short (37.0% of float), days-to-cover 4.7.
- June 30, 2026 settlement: 59,995,000 shares short (37.99% of float), days-to-cover 1.19.
Two dynamics stand out. First, the float percentage has been persistently elevated above 34% since at least late April, indicating that short sellers have maintained conviction through multiple reporting periods. Second, the days-to-cover figure collapsed from 6.26 in late April to 1.19 by June 30 — not because shorts covered, but because average daily volume surged dramatically. Reuters reported that Wendy’s shares rose roughly 25% during the late-June retail-driven move, which inflated the volume denominator and compressed the ratio mechanically.
The bi-monthly cadence of FINRA reporting is a structural limitation here. An 8.3-million-share increase between two settlement dates could reflect gradual accumulation, a single large short-sale event, or intraperiod covering followed by re-shorting — the static print cannot distinguish between those scenarios.

How does days-to-cover work, and what does WEN’s ratio actually mean?
Days-to-cover (also called the short-interest ratio) is calculated as:
Days to cover = Reported shares short ÷ Average daily trading volume
For WEN as of June 30, 2026: 59,995,000 ÷ ~50,400,000 = 1.19 days.
- High days-to-cover (above 5): Shorts would need many days of full average volume to exit, creating significant mechanical covering pressure. WEN was in this zone as recently as the April 30, 2026 settlement (6.26 days), when volume was far lower.
- Medium days-to-cover (1–4): Shorts can cover in a few days at normal volume. The May 29 settlement (4.7 days) and May 15 settlement (3.05 days) both fell here.
- Low days-to-cover (below 1.5): Shorts can theoretically exit in a single session at current volume. WEN’s current 1.19 reading sits in this zone, which sounds reassuring for shorts — but it is misleading in a high-volume rally context.
The critical caveat: the volume figure used in the denominator is the settlement-period average, which was inflated by the retail-driven surge in late June. If daily volume reverts toward pre-surge norms, the effective days-to-cover rises sharply. A stock trading 50 million shares per day during a squeeze may revert to 10–15 million shares per day once the retail momentum fades, which would push the ratio back toward 4–6 days. Practitioners who rely on the published 1.19 figure without adjusting for normalized volume risk underestimating the covering burden. Dark-pool activity adds a further complication: a meaningful share of daily volume may be internalized and unavailable to short-covering buyers, making the effective liquidity pool smaller than the headline volume implies.
What mechanics drive a short squeeze, and where does Wendy’s stand?
Three distinct mechanisms can produce a short squeeze, and all three are currently relevant to WEN.
Borrow scarcity and borrow-fee stress are the most direct signal. When available shares to borrow fall and the cost to maintain a short position rises, the economics of holding the short deteriorate. ShortInterestTracker recorded a borrow fee as high as approximately 20% on July 1, 2026, and available shares as low as 9,000 on June 29, 2026. Those are extreme readings. By mid-July, the fee had moderated to roughly 4.28% with approximately 350,000 shares available — still elevated relative to typical large-cap borrow conditions, but meaningfully less stressed than the late-June peak. When borrow fees spike and availability collapses simultaneously, prime brokers can issue forced buy-in notices, which compel shorts to cover regardless of their view on the stock.
Dealer gamma hedging creates a second, self-reinforcing channel. When retail traders buy call options aggressively, market-makers who sold those calls are net short gamma. As the stock price rises, dealers must buy the underlying to maintain a delta-neutral hedge, which pushes the price higher, which requires more hedging buying. This feedback loop can accelerate upward moves well beyond what the fundamental short-covering alone would produce. The operational core of a gamma squeeze is that market-makers, not retail buyers, become the dominant buyers of the stock during the acceleration phase.
Retail order-flow feedback loops are the third channel. Sustained retail inflows, not a single-day volume spike, are what distinguish a durable squeeze from a one-session pop. Reuters coverage of the late-June 2026 move described large retail inflows coinciding with the price gains. S3 Partners’ analysis identified Wendy’s as having flipped to a high-squeeze-risk profile, with active longs exceeding shorts at a Long/Short Ratio of approximately 1.47x and short interest near a ten-year high in its reporting window.
“Wendy’s moved from a battleground stock to one with elevated squeeze risk as active longs rebuilt and shorts accumulated to near ten-year highs.” — S3 Partners, June 2026
Pro Tip: Monitor intraday borrow-fee prints on ShortInterestTracker rather than waiting for the bi-monthly FINRA report. A borrow fee that doubles within a single session, combined with available shares dropping below 50,000, is a higher-fidelity squeeze signal than any static short-interest percentage. Pair that with options dealer positioning data from a gamma-exposure scanner to identify when dealers are likely to become net buyers.
How can you track Wendy’s short interest and squeeze signals in real time?
Effective monitoring requires layering multiple data sources at different refresh frequencies. No single feed captures the full picture.
- FINRA/Nasdaq short-interest reports: The authoritative bi-monthly settlement figures. Check after each settlement date (typically published two weeks post-settlement). Use these for the official shares-short count and float percentage.
- MarketBeat (WEN short-interest page): Aggregates FINRA data with a historical chart and short-interest ratio. Useful for trend context and quick reference. Refresh after each FINRA publication.
- ShortInterestTracker (intraday feed): Publishes borrow fees and available shares at intraday granularity. This is the primary tool for real-time squeeze stress monitoring. Check at least twice daily when borrow fees are elevated; check hourly during active squeeze conditions.
- S3 Partners: Institutional-grade positioning data, including long/short notional ratios and short-interest estimates between FINRA settlement dates. Useful for understanding whether institutional longs are providing sustained buying support.
- Options flow scanners: Monitor unusual call-buying activity in WEN options. A surge in near-term call purchases, particularly at strikes above the current price, signals potential gamma-squeeze setup. Refresh intraday.
- Vanda Research: Tracks retail order-flow data and can identify whether retail inflows are sustained or fading. Vanda’s borrow-cost monitoring recommendations align with the practitioner consensus that borrow fees and real-time availability are better real-time signals than bi-monthly prints.
Refresh cadence by signal type:
| Signal | Recommended Refresh | Watch Window |
|---|---|---|
| FINRA/Nasdaq short-interest report | Bi-monthly (post-settlement) | Settlement dates + 2 weeks |
| MarketBeat summary | Bi-monthly | After each FINRA publication |
| ShortInterestTracker borrow fee | Intraday (2x daily minimum) | Hourly during active squeeze |
| ShortInterestTracker availability | Intraday | Hourly when fee above 10% |
| Options flow (call buying) | Intraday | Pre-market + continuous |
| S3 Partners positioning | Weekly | Around earnings / news events |
| Vanda retail flow | Daily | Sustained-inflow confirmation |
For a deeper look at which platforms best serve WEN-specific data needs, the best platform guide for Wendy’s stock data covers the full comparison of free and paid tools.
How does Wendy’s short interest compare with restaurant-sector peers?
Contextualizing WEN’s metrics against the broader quick-service restaurant (QSR) and casual dining sector helps clarify whether the current short positioning is an outlier or sector-wide phenomenon.

| Company | Shares Sold Short | % of Float | Days to Cover | Recent Change | Borrow Cost / Availability | Retail / Options Activity |
|---|---|---|---|---|---|---|
| WEN (Wendy’s) | 59,995,000 | 37.99% | 1.19 | +16.12% (Jun 15–30) | Fee ~20% peak; 9K avail. trough | High retail inflows; active call buying |
| Large QSR peer A | Not publicly sourced | Typically 5–15% | Typically 2–5 | Stable | Low fee; ample availability | Moderate |
| Mid-cap casual dining B | Not publicly sourced | Typically 10–25% | Typically 3–5 | Moderate | Moderate fee | Low-to-moderate |
Peer figures for large QSR peer A and mid-cap casual dining B are directional sector benchmarks based on typical float-short ranges for the category. Readers should verify current figures from MarketBeat or ShortInterestHistory with the applicable settlement date before trading.
The contrast is stark. A float-short percentage near 38% is well above the typical 5–15% range for large-cap QSR peers, and a borrow fee that reached approximately 20% is characteristic of a stock under acute short stress, not routine institutional hedging. The fast-food industry stock trends analysis on Buywendys provides additional sector context for readers assessing whether WEN’s positioning reflects company-specific bearish conviction or broader sector rotation.
Key observations from the peer comparison:
- WEN’s float-short percentage is roughly 2–4x the typical large QSR peer range, indicating concentrated bearish positioning specific to Wendy’s rather than a sector-wide short trade.
- Borrow fees at or above 10% are rare for established restaurant chains with liquid float; WEN’s late-June peak of approximately 20% places it in the top tier of borrow stress for the sector.
- Days-to-cover at 1.19 looks low in isolation but reflects inflated volume; normalized to pre-surge volume, the effective ratio is materially higher.
For readers assessing whether institutional sentiment is shifting alongside the short positioning, the institutional sentiment guide for Wendy’s stock provides the long-side counterpart to this short-interest analysis.
How do you score Wendy’s short-squeeze probability right now?
Use this checklist to assess current squeeze conditions. Items marked with higher weight should carry more influence in your overall assessment.
- Borrow fee elevated (HIGH WEIGHT): Fee peaked near 20% on July 1, 2026; moderated to approximately 4.28% by mid-July. A fee above 10% with availability below 50,000 shares is the highest-fidelity squeeze signal. Currently: moderate stress, trending down from peak.
- Percent of float shorted (HIGH WEIGHT): 37.99% as of June 30, 2026. Readings above 30% in a liquid mid-cap stock indicate concentrated short positioning with meaningful covering demand if sentiment shifts. Currently: elevated.
- Days-to-cover adjusted for normalized volume (MEDIUM WEIGHT): Published ratio of 1.19 is misleading at surge volume. At normalized volume, the effective ratio is materially higher. Currently: medium covering burden.
- Sustained retail inflows (HIGH WEIGHT): Reuters documented large retail inflows in late June 2026. A single-day spike is insufficient; look for 5+ consecutive sessions of above-average retail buying. Currently: monitor for continuation.
- Institutional positioning (MEDIUM WEIGHT): S3 Partners reports a Long/Short Ratio of approximately 1.47x, with active longs exceeding shorts. Institutional long rebuilding provides sustained buying support that retail spikes alone cannot replicate.
- Options/gamma flows (MEDIUM WEIGHT): Active call buying in near-term strikes can trigger dealer hedging buying. Monitor options flow scanners for unusual call volume relative to open interest. Currently: watch for re-escalation.
- Company-specific catalysts (SITUATIONAL): Take-private speculation, management changes, activist involvement, or a material earnings beat can serve as the ignition event that converts elevated short interest into a covering cascade. Readers researching potential M&A angles may find restaurant sell-side advisory context useful when evaluating restaurant business transactions.
Risk reminder: Short-squeeze trading is asymmetric and can move faster than most position-management frameworks accommodate. A stock can gain 25% in days and reverse just as quickly. Before sizing any position around squeeze anticipation, stress-test the scenario against a reversion to pre-squeeze price levels, account for the bid-ask spread widening that accompanies high-volatility sessions, and confirm that at least three of the high-weight checklist items are simultaneously active. Single-signal trades on short-interest data alone have a poor track record.
What is the verdict on Wendy’s short-squeeze risk?
WEN presents a medium-to-high short-squeeze risk profile as of the June 30, 2026 settlement, supported by two primary data points: 59,995,000 shares sold short representing 37.99% of float, and a borrow fee that reached approximately 20% in late June before moderating. S3 Partners’ characterization of Wendy’s as having flipped to a high-squeeze-risk profile, with a Long/Short Ratio of approximately 1.47x, adds institutional-positioning support to the thesis. The mechanical squeeze window is narrower than the float percentage alone suggests, because the inflated daily volume compresses the days-to-cover ratio to 1.19. The more meaningful risk for short sellers is a borrow-fee re-escalation combined with sustained retail inflows, which would recreate the late-June conditions. For long-side traders anticipating a squeeze, the absence of a confirmed catalyst and the moderation in borrow fees since early July 2026 argue for patience over aggressive positioning.
Investor risk reminder: Short-squeeze anticipation is a high-risk strategy. Positions can experience rapid, disorderly price moves in either direction. Liquidity risk, forced-cover risk, and volatility risk are all elevated when float-short percentages exceed 30%. This article is general analytical information, not investment advice. Confirm current data with primary sources and consult a qualified financial professional before making trading decisions.
Key Takeaways
Wendy’s short interest at 37.99% of float as of June 30, 2026 places WEN in a medium-to-high squeeze-risk category, with borrow-fee stress and sustained retail inflows as the highest-fidelity signals to monitor.
| Point | Details |
|---|---|
| Shares short and float % | 59,995,000 shares short, 37.99% of float as of June 30, 2026 (FINRA/MarketBeat). |
| Borrow-fee stress | Fee peaked near 20% on July 1, 2026; availability fell to ~9,000 shares on June 29, 2026. |
| Days-to-cover caveat | Published ratio of 1.19 reflects surge volume; normalized volume produces a materially higher effective ratio. |
| Monitoring priority | Intraday borrow-fee feeds and options flow scanners provide better real-time squeeze signals than bi-monthly FINRA prints. |
| Buywendys research | Buywendys tracks WEN-specific catalysts, institutional sentiment, and data-platform guidance for active investors monitoring short dynamics. |
Why borrow fees matter more than the headline short-interest number
The conventional focus on percent-of-float shorted is understandable — it is the most widely reported figure, and 37.99% is genuinely elevated. But the float percentage is a lagging indicator by design. It reflects positions as of a settlement date two weeks before publication, and it tells you nothing about whether those positions are under financial stress right now.
Borrow fees are different. A fee that moves from 4% to 20% within a week signals that prime brokers are running out of lendable inventory and that the cost of maintaining short positions is rising fast enough to alter the economics of the trade. The late-June 2026 episode, where ShortInterestTracker recorded availability as low as 9,000 shares and fees near 20%, is exactly the kind of signal that precedes forced buy-ins. By the time the next FINRA settlement report is published, the squeeze may already have run its course.
The deeper issue is that most retail investors and many institutional traders build their squeeze theses around the bi-monthly print and miss the intraday borrow dynamics entirely. S3 Partners’ institutional-positioning data adds a useful middle layer, but even that is not intraday. The practitioners who consistently identify squeeze setups early are the ones monitoring borrow-fee feeds alongside options dealer positioning, not the ones waiting for the next FINRA report to confirm what the market already priced in two weeks earlier. For WEN specifically, the combination of a near-ten-year short-interest high and a borrow-fee spike of that magnitude in the same window is a rare convergence worth taking seriously, even after the initial move.
Buywendys covers WEN short dynamics so you don’t have to start from scratch
Tracking Wendy’s short interest across FINRA settlement dates, intraday borrow feeds, and options flow scanners is time-intensive work. Buywendys consolidates that research into analyst-grade reports and alerts built specifically around WEN, so active investors can focus on decision-making rather than data aggregation.
The bull vs. bear case analysis for Wendy’s stock maps the squeeze scenario against the fundamental valuation range, giving traders a framework for sizing positions relative to downside risk. The platform guide for Wendy’s stock data identifies which free and paid tools provide the intraday borrow-fee and options-flow data that matter most during active squeeze conditions. Both are updated as new settlement data and borrow-fee prints become available. Visit Buywendys to access the current WEN research and set up alerts for the signals that matter.
Useful sources for tracking Wendy’s short interest
Bookmark these primary data sources and note the free vs. paid distinction before building a monitoring workflow.
- FINRA/Nasdaq short-interest reports (free): The authoritative bi-monthly settlement figures for WEN. Published approximately two weeks after each settlement date. Access via the Nasdaq market-activity page for WEN. Always record the settlement date when citing these figures.
- MarketBeat WEN short-interest page (free with registration): Aggregates FINRA data, adds historical chart, short-interest ratio, and percent-of-float trend. Useful for quick reference and trend context.
- ShortInterestTracker (free tier + paid intraday): Publishes borrow fees, available shares, and intraday timestamps. The paid feed provides the granularity needed for real-time squeeze monitoring. Always note the timestamp when recording borrow-fee or availability figures.
- S3 Partners (paid, institutional): Provides long/short notional positioning, short-interest estimates between FINRA settlement dates, and squeeze-risk scoring. The primary institutional-grade source for WEN positioning analysis.
- OptionsAnalysisSuite (free + paid tiers): Documents options flow, gamma exposure, and dealer positioning for WEN. Use alongside borrow-fee data to identify gamma-squeeze setup conditions.
- Vanda Research (paid, institutional): Tracks retail order-flow data and borrow-cost trends. Vanda’s recommendation to monitor borrow-cost feeds alongside options flow reflects the practitioner consensus on real-time squeeze diagnostics.
- Buywendys premium research and alerts (paid): WEN-specific reports covering short-interest trends, institutional sentiment, valuation scenarios, and platform recommendations. Updated around FINRA settlement dates and material company events.