
Wendy’s menu pricing is regionally variable but strategically managed through tiered Biggie Deals ($4/$6/$8), targeted promotions like the $1 Frosty, and digital incentives including Paze integration — all of which feed systemwide sales, franchise royalties, and average unit volume (AUV). For modeling purposes, treat advertised national prices as a baseline, not a realized figure: franchise autonomy, regional cost differentials, and promotional mix shift the actual revenue picture materially. FreshAI drive-thru technology adds another layer by influencing attach rates and throughput. The one-sentence investor verdict: model Wendy’s menu price as a regionalized, mix-driven input and track Biggie Deals adoption, FreshAI rollout progress, and app-driven frequency changes as the leading signals.
Key investor signals at a glance:
- Biggie Deals structure: tiered entry points designed to preserve frequency while encouraging upsell
- $1 Frosty promotional pricing: a high-visibility, low-margin item used to drive traffic and attach rates
- Paze payment integration: supports app-based incentives and first-party data collection that can lift repeat purchase frequency
- FreshAI: AI-powered drive-thru technology affecting throughput, upsell attach rates, and store-level economics
- Wendy’s 10-K and quarterly earnings: the authoritative source for royalty rates, company-store counts, and franchised/corporate revenue splits
Table of Contents
- How does Wendy’s menu pricing actually work for franchisees?
- Which pricing initiatives most affect Wendy’s revenue and margins?
- How do you convert menu price changes into investor metrics?
- Why do Wendy’s prices vary so much across U.S. markets?
- How do you build a menu-price tracker for ongoing analysis?
- A compact sensitivity sketch for royalties and EBITDA
- Key Takeaways
- Why menu pricing analysis belongs at the center of any WEN thesis
- Buywendys resources for menu-pricing and valuation modeling
- Primary sources for building a menu-pricing model
How does Wendy’s menu pricing actually work for franchisees?
Franchisees set retail menu prices. Wendy’s corporate provides recommended national pricing and designs national promotions, but price realization is local. That distinction matters for revenue modeling because the path from a customer’s checkout price to corporate revenue runs through several steps: the consumer pays the franchisee’s local price, that generates store-level sales, and Wendy’s corporate collects a royalty on those franchised sales plus rent on leased locations.
Franchise pricing autonomy means the “national” menu is advisory. Operators can price above or below the recommended figure based on local labor costs, real estate, and competitive dynamics. Wendy’s own communications note that prices and participation vary by location, with higher price floors observed in Alaska, California, and Hawaii.
The operational levers franchisees and corporate use include value-menu participation, bundle design (Biggie Deals), time-of-day pricing, delivery channel pricing, and app or loyalty offers. For investors, the implication is straightforward: use franchise ownership mix and operator pricing autonomy to convert list price into forecasted realized revenue per store, not a single national figure. The franchise economics breakdown published by Buywendys provides the FDD-based detail needed to make that allocation accurately.
Which pricing initiatives most affect Wendy’s revenue and margins?
The programs with the clearest revenue impact are Biggie Deals, limited-time offers, the $1 Frosty promotion, app incentives via Paze, and FreshAI-assisted upsell experiments in the drive-thru.
Biggie Deals — available at participating restaurants, with price and participation varying by location — provide a structured low, mid, and high entry point. The $4 tier preserves a low-cost entry for frequency-sensitive customers; the $8 tier creates a bundle upsell opportunity with meaningfully better margin per transaction. That tiering is a mix-management lever: it keeps traffic during inflationary periods while nudging higher-spending customers toward the upper tiers.
Key programs to monitor:
- Biggie Deals ($4/$6/$8): track deal participation rates and attach rates for add-ons (beverages, desserts) to estimate incremental margin per transaction
- $1 Frosty promotion: Wendy’s homepage promotions explicitly note the $1 Small Classic Frosty and flag that prices may be higher in Alaska and Hawaii or for delivery — treat this as a traffic driver, not a margin contributor on its own
- Paze integration: app-based cash-back and delivery discounts support first-party data collection and repeat purchase frequency; watch app redemption rates as a proxy for loyalty-driven AUV lift
- FreshAI: drive-thru AI technology affects throughput and upsell attach; the FreshAI economics analysis from Buywendys quantifies the store-level margin and fee implications
Pro Tip: Watch whether Biggie Deals adoption cannibalizes higher-margin core items or expand visit frequency from price-sensitive customers. Buywendys’s margin work on earlier $1 Frosty promotions — see the Frosty margin analysis — provides a useful template for estimating net promotional impact.

How do you convert menu price changes into investor metrics?
Translate observed price and mix changes into AUV and systemwide sales first, then split into corporate revenue streams (royalty, rent, company-owned store sales) and franchisee economics using the royalty rates and company-store metrics disclosed in the 10-K and quarterly earnings.
Two core formulas anchor the work:
- Royalty revenue change = royalty rate × change in franchised systemwide sales
- Company-store margin change = change in menu price × company-store mix × (1 − variable cost %)
Always pull the royalty percentage and company-store weighting from current filings before running any scenario. Those figures shift with refranchising activity and should not be assumed constant year over year.
Worked modeling steps:
- Estimate the percentage menu price change by market, weighting high-cost states (AK, CA, HI) separately
- Apply the price change to estimated sales mix (value-tier vs. core items) to get a blended realized price shift
- Split the resulting systemwide sales change between franchised and corporate stores using the ownership percentages from the most recent 10-K
- Compute incremental royalty revenue using the disclosed royalty rate applied to the franchised sales increment
- Compute incremental company-store EBITDA by applying the variable cost percentage to the company-store sales increment
Modeling note: Wendy’s quarterly earnings disclosures are the authoritative source for royalty rates, company-store counts, and the franchised/corporate revenue split. Never substitute estimated figures when the filing data is available.
Why do Wendy’s prices vary so much across U.S. markets?
Prices are higher on average in Alaska, California, and Hawaii because of labor costs, logistics, local taxes, and cost-of-living effects. Franchise autonomy amplifies that variation: two locations in the same metro can price the same SKU differently based on operator decisions.
Key drivers of regional price divergence:
- Labor costs: state and local minimum wage levels directly affect operator cost structures and flow into menu pricing decisions
- Supply chain and logistics: remote markets (Alaska, Hawaii) carry higher distribution costs that operators pass through to menu prices
- Local taxes and regulations: sales tax treatment and local surcharges vary by jurisdiction
- Value program participation: not all franchisees participate in every national promotion; delivery pricing may be higher than in-restaurant prices even within the same market
Live price trackers pulling data from thousands of U.S. locations confirm meaningful item-level spreads across the system. Franchise pricing fragmentation can produce 15–25% price differences on the same SKU between nearby locations, which means realized price is better modeled as a distribution than a single number.
Pro Tip: When building national AUV assumptions, construct a weighted regional price ladder — urban vs. rural, high-cost states vs. the rest of the country — rather than applying a single national average. Collapsing AK, CA, and HI into a national mean will overstate the price floor for the majority of the system.
How do you build a menu-price tracker for ongoing analysis?
Build a repeatable data pipeline that captures store-level prices from the menu board or app, promotion participation flags, delivery versus in-store pricing, and store ownership type. The live tracker dataset covering 6,600-plus U.S. locations is a useful baseline for calibrating your own sample.
Step-by-step tracking plan:
- Select a representative store sample by market and ownership mix (franchised vs. corporate), weighting for high-cost states
- Record menu prices and promotion flags on a weekly cadence, noting any Biggie Deal or $1 Frosty participation
- Capture the delta between app prices and menu-board prices at the same location
- Log delivery platform price premiums separately to avoid overstating base AUV
Suggested data table schema:
| Field | Description |
|---|---|
| store_id | Unique location identifier |
| market/state | Geographic market and state code |
| date | Observation date |
| item_sku | Menu item identifier |
| list_price | In-store menu board price |
| app_price | Price via Wendy’s app at same location |
| delivery_price | Price via delivery platform |
| promotion_flag | Active promotion (Biggie Deal / $1 Frosty / other) |
| ownership_type | Franchised or corporate-owned |
| notes | Anomalies, temporary closures, regional caveats |

Tracking delivery prices separately is not optional. Delivery channel premiums inflate apparent AUV if mixed into the base price series, distorting royalty and margin estimates.
A compact sensitivity sketch for royalties and EBITDA
A +2% national menu price increase combined with a 3% shift from value-tier mix to core items will raise systemwide sales and royalties, but the company-store EBITDA impact depends on company-store mix and variable cost assumptions. Model at least three scenarios.
Stepwise sensitivity example:
- Assume +2% list price increase across the system
- Apply 50% pass-through to realized price, reflecting franchise variance and partial promotion displacement
- Apply the realized price change to current AUV estimates; split the resulting systemwide sales increment by franchised vs. corporate store percentages from the most recent 10-K
- Compute incremental royalty: ΔRoyalty $ = royalty_rate × ΔSystemwide sales
- Compute incremental company-store EBITDA: ΔCompany EBITDA ≈ company_store_share × ΔRealized price × company_margin_factor
Scenario discipline: always model base, upside, and downside cases. Cannibalization (value customers trading down or exiting), promo displacement (Biggie Deals replacing higher-margin transactions), delivery premium inflation, and sample-size error each pull in different directions. A single-point estimate is not a model.
For the full valuation framework that incorporates these sensitivity inputs, the Wendy’s stock valuation model guide at Buywendys provides a structured template.
Key Takeaways
Wendy’s menu pricing is a regionalized, mix-driven input — not a single national figure — and the signals that matter most to investors are Biggie Deals adoption rates, FreshAI throughput changes, and app-driven frequency data from quarterly earnings disclosures.
| Point | Details |
|---|---|
| Biggie Deals adoption | Track tier participation rates and add-on attach rates each quarter to estimate mix and margin shifts. |
| FreshAI rollout | Monitor drive-thru throughput and upsell attach changes as FreshAI expands; see Buywendys’s FreshAI economics analysis for the margin framework. |
| App and Paze engagement | App redemption frequency and Paze cash-back uptake are leading indicators of loyalty-driven AUV improvement. |
| Regional price outliers | Weight AK, CA, and HI separately in national models; significant SKU-level price differences between nearby locations make a single national average unreliable. |
| Buywendys coverage | Buywendys overlays 10-K royalty rates, FDD franchise economics, and proprietary margin work into quarterly model updates — the fundamental analysis report is the starting point for building these inputs. |
Why menu pricing analysis belongs at the center of any WEN thesis
Most retail investors treat Wendy’s menu prices as consumer trivia. That framing misses the point. Menu pricing is the upstream input that determines systemwide sales, which in turn sets the royalty base that drives the majority of Wendy’s corporate revenue. When Wendy’s introduces a tiered structure like Biggie Deals, it is not running a marketing campaign — it is making a deliberate mix-management decision that will show up in AUV trends, same-store sales comps, and royalty line items within two to three quarters.
The $1 Frosty promotion illustrates the tension well. It generates traffic and attach-rate benefits, but the margin math is unforgiving at the store level. Whether that trade-off is net positive for the system depends on how many incremental transactions it drives and what those customers order alongside the Frosty. That is exactly the kind of question that requires a structured tracking approach, not a headline read.
FreshAI adds a newer variable. If the technology improves drive-thru throughput and upsell attach rates at scale, it effectively raises realized revenue per transaction without a nominal price increase — a form of pricing power that does not appear in the menu board figure but does appear in AUV. Investors who track only the listed price will miss it entirely.
Buywendys resources for menu-pricing and valuation modeling
Buywendys publishes the most detailed independent analysis of Wendy’s franchise economics, menu-pricing dynamics, and WEN stock fundamentals available to retail investors and analysts. If the framework in this article is where you want to start, the Wendy’s stock fundamental analysis report is the logical next step: it incorporates royalty rates, company-store metrics, and menu-pricing sensitivity scenarios into a single structured model.
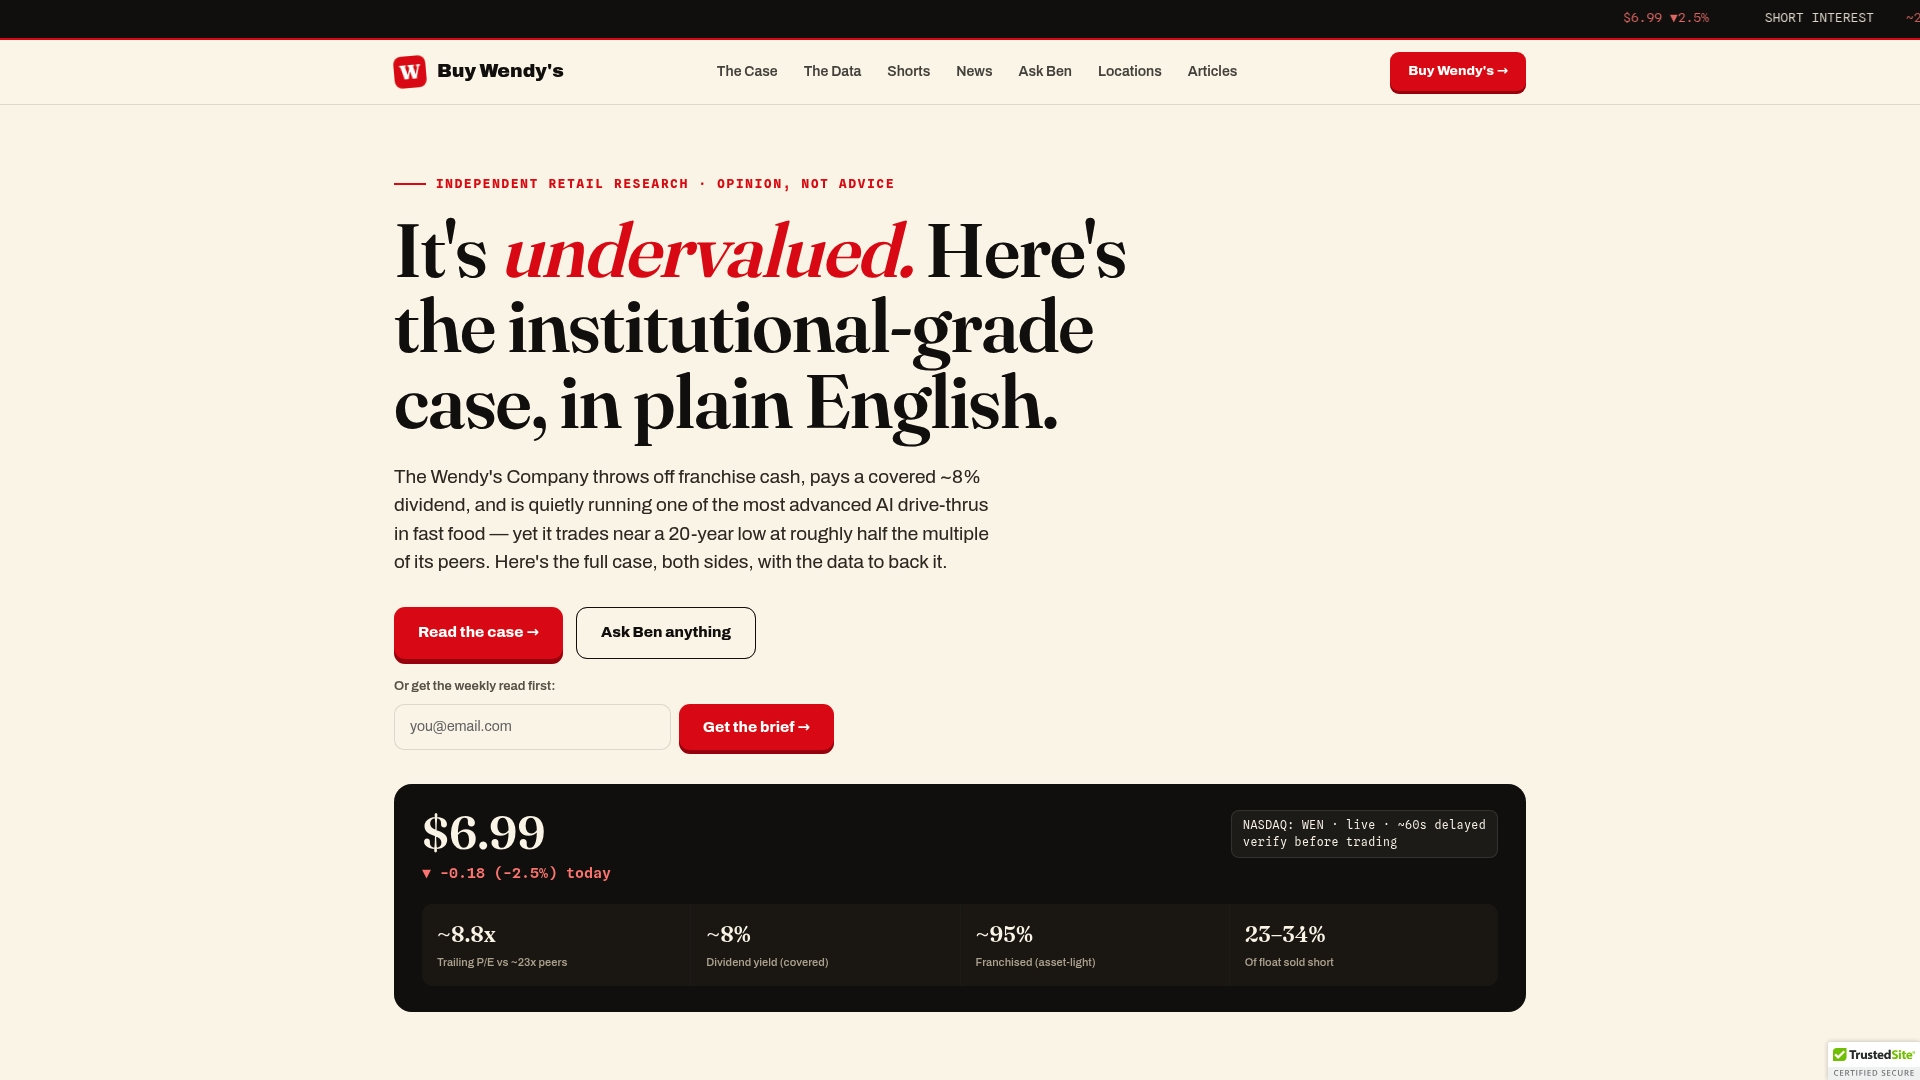
For investors who want to go deeper on the bull and bear cases for WEN stock — including how menu-pricing trends feed into the broader thesis — the bull vs. bear case analysis at Buywendys lays out both sides with the same level of financial rigor. Subscribe to Buywendys for quarterly model updates, AUV tracker refreshes, and earnings-cycle breakdowns as new data becomes available.
Primary sources for building a menu-pricing model
Use these documents and datasets as the foundation for any menu-pricing analysis of Wendy’s:
- Wendy’s 10-K (annual filing): authoritative source for royalty rates, company-store counts, franchised/corporate revenue split, and systemwide sales figures — pull directly from SEC EDGAR
- Wendy’s quarterly earnings releases and footnotes: update royalty rates and company-store metrics each quarter; cross-reference guidance commentary for pricing and promotional outlook
- Biggie Deals press release: official tier structure ($4/$6/$8), participation notes, and regional price caveats — cite by release date in models
- Wendy’s official meal deals page: current promotion descriptions, participation language, and delivery price disclosures — sync weekly during active promotional periods
- Live price tracker (6,600+ U.S. locations): item-level low/high ranges and national averages useful for calibrating baseline assumptions and detecting regional outliers
- Delivery platform menus: record delivery prices separately from in-store prices; Wendy’s order pages and third-party platforms both reflect delivery premiums that must be isolated to avoid overstating base AUV
This article is general financial and operational analysis, not investment advice. Confirm current royalty rates, store counts, and promotional terms directly from Wendy’s SEC filings and official communications before incorporating them into any investment model.