
A restaurant commodity basket is a weighted set of input-commodity prices, beef, cheese, potatoes, oil, dairy, and similar line items, that analysts index and use to convert wholesale price moves into menu-level cost and margin exposure. The basket exists to answer one question for a modeler: when a specific commodity spikes, how many basis points of operating margin does that spike actually consume once you account for menu mix, contracts, and distribution?
Two anchors matter immediately. The Producer Price Index (PPI) for All Foods gives you the broad public benchmark for food-input inflation, and a resource like Buywendys gives you a chain-specific lens for translating that benchmark into franchisee and company-operated margin outcomes.
- The basket’s main job: convert a commodity price move into plate-level cost, then into margin and EPS sensitivity.
- It is weighted, not equal, because menu mix determines exposure (a beef-heavy chain feels cattle prices differently than a coffee-led concept).
- Public indices tell you direction; a chain-specific basket tells you magnitude.
Key Takeaways
A restaurant commodity basket only earns its place in a model when it converts wholesale price moves into weighted, plate-level cost impact rather than restating a headline inflation number.
| Point | Details |
|---|---|
| Weight by menu mix | Set basket weights from revenue-impact share, not just volume, since low-cost items like potatoes can carry outsized exposure. |
| Use public data as baseline | Pull PPI, USDA, and FRED series first, then cross-check with a commercial composite like Muntin for higher-frequency reads. |
| Model the distribution tax | Build the 3 to 10% franchisee distribution premium as its own line item rather than assuming independent sourcing economics. |
| Separate wholesale from plate cost | Apply yield, processing, and markup factors, since a 5% wholesale move rarely produces a 5% plate-cost move. |
| Run cut-level stress cases | Composite beef prices can mask cut-level swings of 6 to 7% that materially change a burger-led margin forecast. |
Table of Contents
- What Goes Into a Restaurant Commodity Basket?
- Which Data Sources Should Analysts Pull From?
- How Do You Build a Weighted Basket From Scratch?
- How Do Commodity Moves Translate Into Margin and EPS?
- Why Do Franchised Systems Change the Exposure Math?
- What Tools and Templates Operationalize the Basket?
- What Does a Beef-Driven Stress Case Actually Look Like?
- How Buywendys Supports Your Basket Assumptions
- Where to Turn for Wendy’s-Specific Analysis
- What the Basket Approach Gets Wrong in Most Coverage
- Frequently Asked Questions
- Sources
What Goes Into a Restaurant Commodity Basket?
The core inputs for most quick-service concepts fall into a predictable set, but their weight in the basket depends entirely on what the menu sells.
- Beef — ground beef, chuck, and other cuts drive cost for burger-forward chains and are currently among the most volatile line items in the group.
- Poultry — chicken breast and tenders matter heavily for any concept with a chicken-forward value platform.
- Cheese and dairy — shredded cheese, milk, and butter affect burger toppings, breakfast items, and frozen dessert lines simultaneously.
- Potatoes — fries remain a fixed-attachment item across nearly every QSR order, so potato prices carry outsized weight even at modest cost share.
- Frying oil — a smaller dollar line than beef but a volatile one, since vegetable oil prices track global crop and biodiesel demand.
- Wheat and flour — buns, tortillas, and breading connect the basket to grain markets.
- Sugar — beverages and desserts.
- Coffee — a growing weight for chains pushing beverage attach rates.
- Produce — lettuce, tomatoes, and onions, seasonal and freight-sensitive.
A burger-led concept skews the basket toward beef and cheese; a pizza-led concept skews toward cheese and wheat; a coffee-led concept skews toward dairy and green coffee. The same national PPI print can mean very different margin outcomes depending on which weights dominate.
Which Data Sources Should Analysts Pull From?
Public data does the heavy lifting for baseline modeling, and each series answers a different question.
- The BLS PPI for All Foods publishes monthly and gives you the direction and pace of wholesale food inflation, plus subseries for specific commodities.
- USDA wholesale price series and Agricultural Marketing Service reports give spot-level quotes for meat, dairy, and produce, useful for cross-checking PPI moves at the commodity level.
- FRED (Federal Reserve Economic Data) lets you pull these series programmatically and standardize them into a common time index for modeling.
- Commercial composites, like the Muntin restaurant basket, which tracks 16 staples against baselines, help separate genuine market moves from vendor markup.
Statistic callout: PPI for All Foods fell 1.2% between June and July 2026 but remained 34% above February 2020 levels, with fresh vegetables down 40.1% and beef and veal down 4.1% that same month, even as many individual beef cuts stayed elevated year-over-year. Headline PPI direction and specific cut-level exposure can diverge sharply in the same reporting period.
How Do You Build a Weighted Basket From Scratch?
Building the basket is a mechanical process once you have an ingredient list, but the sequencing matters.
- Choose a baseline window. Decide whether you’re indexing level prices or percent changes from a fixed base period; percent-change indexing is easier to compare across commodities with different price scales.
- Set weights. Start with volume share (units purchased), then refine to cost share (dollars spent), then refine again to revenue-impact share, since a commodity that is cheap per unit but touches every order (like potatoes) can matter more than a pricier item with thin menu penetration.
- Convert wholesale to plate cost. Apply yield factors (trim loss, cook shrink), processing costs, and distributor markup. A 5% wholesale beef move rarely becomes a 5% plate-cost move once yield and distribution are layered in, a point should-cost modeling for food makes explicit.
- Govern the model. Version every weight change, log the source and date for each price input, and keep an audit trail so a margin surprise can be traced back to a specific assumption.
Pro Tip: Build your basket in percent-change terms first, then convert to dollar impact only at the final step. Mixing level prices and percent changes mid-model is the most common source of sensitivity errors analysts make when they inherit someone else’s spreadsheet.
How Do Commodity Moves Translate Into Margin and EPS?
Most analysts model commodity risk using standard stress-case sizing, typically +3, +5, and +10 percentage-point shifts in food cost as a share of revenue, applied against a base-case cost structure to see where operating margin lands under each scenario.
Timing matters as much as magnitude. Protein prices carry a feed-to-meat biological lag, meaning a spike in corn or soy prices today shows up in wholesale beef or chicken prices months later, not immediately. Watching feed-cost indices as a leading indicator gives you a head start on protein-cost forecasts rather than waiting for the wholesale print to confirm it.
Hedging levers include futures contracts, forward-priced supplier agreements, and fixed-index purchasing contracts, each of which caps or smooths exposure differently and should be modeled as a dampening factor on your stress-case sensitivity, not ignored.
| Stress Scenario | Food-Cost Impact | Typical Operating-Margin Effect |
|---|---|---|
| +3 pts food cost | Mild input inflation | Modest EBITDA margin compression |
| +5 pts food cost | Moderate, beef-driven spike | Meaningful EBITDA margin compression |
| +10 pts food cost | Severe, multi-commodity shock | Material EBITDA margin compression, pricing action likely |
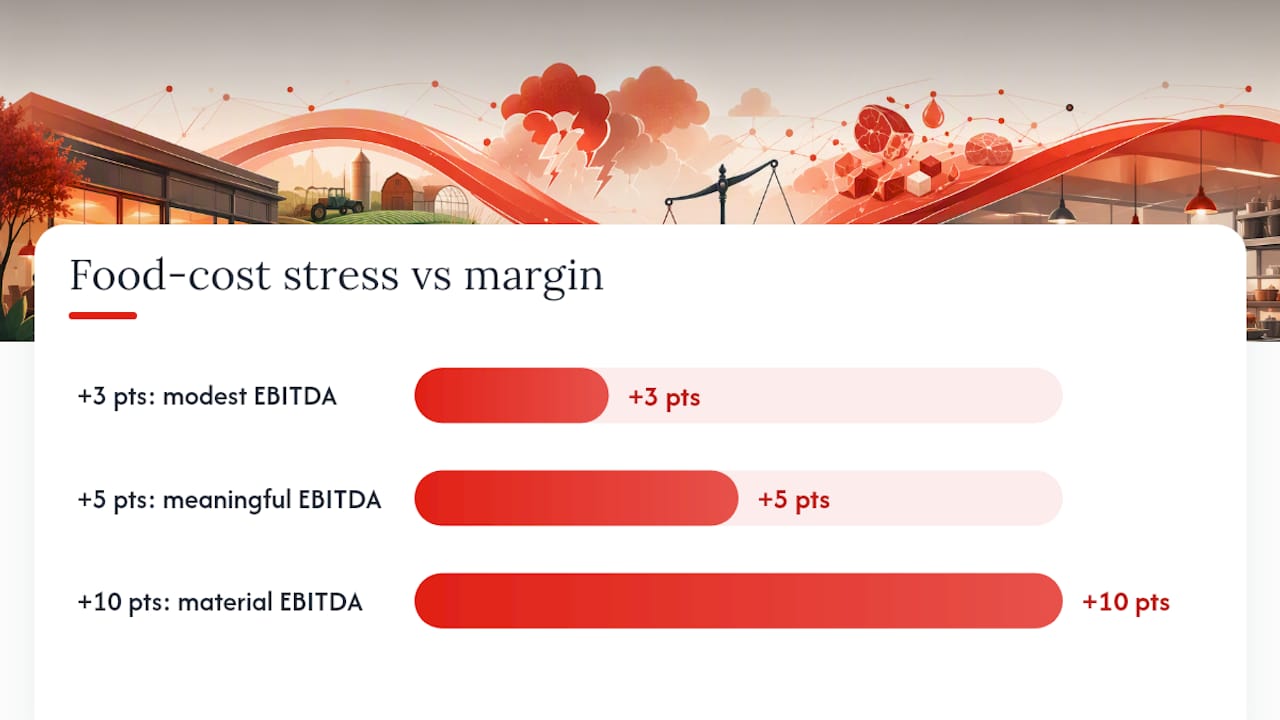
Present results in basis points of operating margin and a corresponding EPS sensitivity range so stakeholders can see the read-through without re-deriving the math themselves.
Why Do Franchised Systems Change the Exposure Math?
Franchised systems do not experience commodity moves the way an independent restaurant does, because approved-supplier programs and distribution agreements sit between the commodity market and the franchisee’s invoice.
- A “distribution tax,” the premium franchisees pay through mandated distributor and supplier programs, typically runs 3 to 10% of food cost and reduces the purchasing flexibility an independent operator would otherwise have.
- Franchise Disclosure Documents, particularly Item 8 (Restrictions on Sources of Products and Services) and Item 19 (Financial Performance Representations), reveal approved-supplier lists, rebate arrangements, and open-purchasing allowances that determine how much margin leakage exists before commodity prices even move.
- National menu-pricing cadence, meaning how often and how uniformly the franchisor adjusts pricing across the system, determines how quickly a commodity spike gets passed through to the consumer versus absorbed by the franchisee in the interim.
Analysts modeling system-wide economics should treat the distribution tax as its own line item rather than assuming franchisee sourcing behaves like an independent operator’s. Buywendys’s franchise cost breakdown walks through how these disclosures apply to a specific system.
What Tools and Templates Operationalize the Basket?
Turning a basket concept into a recurring reporting process requires a few concrete building blocks.
- Ingredient master. Every SKU needs a unique ID, unit of measure, yield factor, pack size, primary vendor, and current cost, the fields that prevent a recipe cost from drifting silently over time.
- Recipe bill of materials (BOM). Each menu item and combo needs a cost-per-portion output tied back to the ingredient master, with contribution margin calculated automatically as ingredient costs update.
- Live feed integration. Pull BLS and FRED series via API, USDA data via CSV export, and supplement with a commercial feed like Muntin or MarginEdge when you need higher-frequency, restaurant-specific readings between official releases.
- Version control. Every model update should be timestamped and diffed against the prior version.
Pro Tip: Treat your recipe BOM like an actual bill of materials, with the same version discipline a manufacturer would apply. A model with untracked ingredient-cost changes is a model nobody should trust for a margin call.
What Does a Beef-Driven Stress Case Actually Look Like?
A worked example makes the mechanics concrete for a burger-led QSR concept.
- Baseline. A quarter-pound burger has a baseline plate cost built from a BOM: beef patty, bun, cheese, condiments, and packaging, with beef typically representing the largest single line item.
- Apply the shock. A +5% wholesale beef move doesn’t translate 1:1 to plate cost once you factor in yield loss, processing, and distributor markup, so the effective plate-cost increase is meaningfully smaller than the headline wholesale figure, often in the low single digits on that item’s food cost.
- Roll up to unit and system level. Multiply the plate-level impact across burger-category volume, then aggregate into total unit food cost as a share of revenue, and finally into operating margin and EBITDA impact for a representative unit.
Statistic callout: cut-level data cited from MarginEdge shows beef chuck up roughly 6.5% since October, with rib eye up 7% in a single month, underscoring why a composite “beef” line in a model can understate the volatility sitting inside individual cuts. Building cut-level detail into the ingredient master, rather than a single blended beef price, catches that variance before it surprises a margin forecast.
How Buywendys Supports Your Basket Assumptions
Benjamin, whose editorial analysis anchors Buywendys’s commodity and margin coverage, draws on public data series and chain-specific disclosures to build the weight and benchmark assumptions analysts need for a working model.
Several Buywendys posts function as direct model inputs rather than background reading:
- Wendy’s beef-cost analysis for beef-weighted stress-case calibration.
- Wendy’s menu pricing guide for pass-through timing assumptions.
- Restaurant operating-margin benchmarks for calibrating your model’s baseline margin range.
- FreshAI’s drive-thru economics for the labor-side offset to commodity pressure.
Pull weights and benchmarks from these pages before finalizing your own basket’s baseline assumptions.
Where to Turn for Wendy’s-Specific Analysis
The mechanics above only matter if you can apply them to a real balance sheet. Buywendys’s Wendy’s stock valuation model guide walks through how commodity-driven margin sensitivity feeds directly into a discounted cash flow or comparable-multiple framework for WEN specifically. If you’re weighing whether the current input-cost environment makes Wendy’s, or QSR peers, an attractive entry point, the fast food stocks to watch roundup is a reasonable next stop for turning this modeling work into a position-level decision.
What the Basket Approach Gets Wrong in Most Coverage
Most commentary on restaurant input costs treats the PPI headline as the story. It isn’t. The headline print tells you almost nothing about a specific chain’s margin exposure unless you already know the menu mix, the cut-level detail inside “beef,” and how much of that cost gets absorbed by a distribution tax before it even reaches the P&L.
The conventional advice, “watch food cost inflation,” is directionally fine and analytically useless. What actually moves a margin forecast is the gap between a composite index and the specific cuts or ingredients a given chain’s menu depends on, plus the structural friction franchised systems add on top of that. A chain that looks exposed on a beef-heavy PPI subseries might be partially insulated by long-dated supplier contracts, while a chain that looks safe on paper might be quietly absorbing a distribution tax that never shows up in any public index.
The single highest-value habit for an analyst here is building the ingredient master first, before touching a stress-case scenario. Skipping that step and jumping straight to sensitivity percentages is how models end up precise and wrong at the same time.

Frequently Asked Questions
What is a restaurant commodity basket, in one sentence?
It’s a weighted set of food-input prices, beef, cheese, potatoes, oil, dairy, and similar items, indexed together so analysts can convert wholesale price moves into menu-level cost and margin exposure.
Is a restaurant commodity basket the same as a grocery cost index?
No. A grocery cost index tracks retail consumer prices, while a restaurant commodity basket tracks wholesale and distributor-level input costs specific to a chain’s menu mix and procurement structure.
How often should analysts update basket weights?
Weights should be reviewed whenever a chain changes its menu mix meaningfully, and price inputs should update at least monthly alongside the PPI for All Foods release cycle.
Why doesn’t a wholesale price spike show up 1:1 in restaurant margins?
Yield loss, processing costs, distributor markups, and existing hedge contracts all dampen the pass-through, which is why should-cost modeling treats wholesale-to-plate conversion as a distinct modeling step rather than a direct copy of the commodity move.
What’s the single biggest blind spot in franchise-system modeling?
Ignoring the distribution tax. Franchisees typically pay a 3 to 10% premium through approved-supplier programs, and that premium changes unit economics independently of any commodity price movement.
This article is general information, not a substitute for advice from a qualified financial advisor. Consult a qualified financial professional about your own circumstances before acting on anything here.
Sources
- Economic Indicators | National Restaurant Association
- How restaurant chains are managing steep beef costs
- Muntin restaurant cost index
- Franchise Food Costs & Commodity Price Risk 2026: How Approved-Supplier Lock-Ins, Distribution Markups, and Rebate Capture Erode Franchisee Margins | FranchiseIQ
- Should-Cost Modeling for Food: What Changes When Your BOM Has a Shelf Life — LightSource Blog