
Wendy’s trades at a material discount to most quick-service restaurant peers on both EV/EBITDA and P/E, and that discount is real, not a data artifact. The two forces offsetting it are a heavier debt load than the industry median and same-store sales growth that trails category leaders. Before treating the discount as an opportunity, an analyst needs to run three checks:
- Normalize EV/EBITDA and P/E for franchise mix, since royalty-heavy peers deserve a premium multiple that has nothing to do with cheapness.
- Check net debt/EBITDA against free cash flow yield, because leverage determines whether that yield is durable or a warning sign.
- Build a bear/base/bull scenario before sizing a position, since the “cheap” verdict changes fast under a multiple re-rating or an EBITDA miss.
Key Takeaways
Wendy’s trades at a discount to most large QSR peers on EV/EBITDA and P/E, but that discount reflects real leverage and comp risk, not a pricing error.
| Point | Details |
|---|---|
| Headline discount is real | Wendy’s EV/EBITDA and P/E sit below the peer median in current relative-valuation screens. |
| Leverage explains part of the gap | Net debt/EBITDA above peer levels means FCF yield needs stress-testing before it counts as a safety signal. |
| Normalize before comparing | Adjust for franchise mix, AUV, and operating margin before treating any multiple gap as an opportunity. |
| Use sub-peer groups | Compare Wendy’s to mid-market franchised peers rather than mega-cap names like McDonald’s or Yum! Brands. |
| Model the scenario spread | Bear/base/bull cases built on EBITDA and multiple assumptions matter more than any single snapshot number. |
| Buywendys tracks the franchise story | Buywendys centers its analysis on franchise cash flow, leverage, and FreshAI-driven margin trends behind the discount. |
Table of Contents
- How Does a QSR Valuation Comparison Actually Work?
- Where Does Wendy’s Rank on the Core Valuation Metrics?
- How Do You Normalize Multiples Across Different Business Models?
- What Happens to Wendy’s Valuation Under Different Scenarios?
- Free Cash Flow Yield and What It Tells You About the Dividend
- Adjusting for One-Time Items and Exceptional Expenses
- How Are Industry Trends and Macro Conditions Reshaping QSR Multiples?
- How Do Growth Prospects Change the Multiple You Should Pay?
- Sources
How Does a QSR Valuation Comparison Actually Work?
A proper qsr valuation comparison starts with picking the right multiple, not the right peer. Restaurant chains sell wildly different business models under one industry label: some collect royalties on franchisee sales, others run company-owned stores with full operating costs and capital spending. That structural gap distorts P/E and EV/Sales comparisons unless you correct for it first.
1. EV/EBITDA measures enterprise value against operating cash generation before financing and accounting choices. It is the standard for comparing a heavily franchised chain to a corporate-operator chain, because it strips out interest expense, depreciation schedules, and tax structure differences that would otherwise make two similar businesses look unlike each other. Practitioners favor it specifically because it neutralizes capital structure and depreciation policy across franchised and corporate models.
2. P/E (trailing and forward) reflects what the market pays per dollar of net income, but it is sensitive to leverage: a highly levered company’s P/E can look distorted even when operating performance is healthy.
3. P/FCF and FCF yield show how much free cash flow investors get per dollar of market value, which matters enormously for dividend payers.
Franchise-heavy operators typically post the highest gross margins and steadiest earnings, which usually justifies a richer EV/EBITDA multiple than a corporate-store chain of similar size. Our own breakdown of these metrics goes deeper into restaurant stock valuation math for readers building their own models.
Pro Tip: Never compare P/E in isolation across QSRs with different debt loads. Pair it with net debt/EBITDA every time, or the “cheap” stock might just be the one carrying the most risk.
Where Does Wendy’s Rank on the Core Valuation Metrics?
The snapshot below pulls from current peer screens and reflects the general positioning investors see when they line Wendy’s up against the largest publicly traded QSR names.
| Company | EV/EBITDA | P/E (TTM) | P/FCF | FCF Yield | Net Debt/EBITDA | Franchise Mix | Operating Margin |
|---|---|---|---|---|---|---|---|
| Wendy’s | Below peer median | Below peer median | Moderate | Elevated | Above peer median | Predominantly franchised | Mid-teens percent |
| McDonald’s | Premium | Premium | Premium | Moderate | Moderate | Predominantly franchised | High (industry-leading) |
| Yum! Brands | Premium | Premium | Moderate | Moderate | Elevated | Predominantly franchised | High |
| Restaurant Brands International | Above median | Above median | Moderate | Moderate | Elevated | Predominantly franchised | High |
| Jack in the Box | Below median | Volatile | Low | Elevated | High | Mixed, franchising increasing | Mid |
| Chipotle | Rich premium | Rich premium | Rich premium | Low | Low | Fully corporate-owned | High, growth-driven |
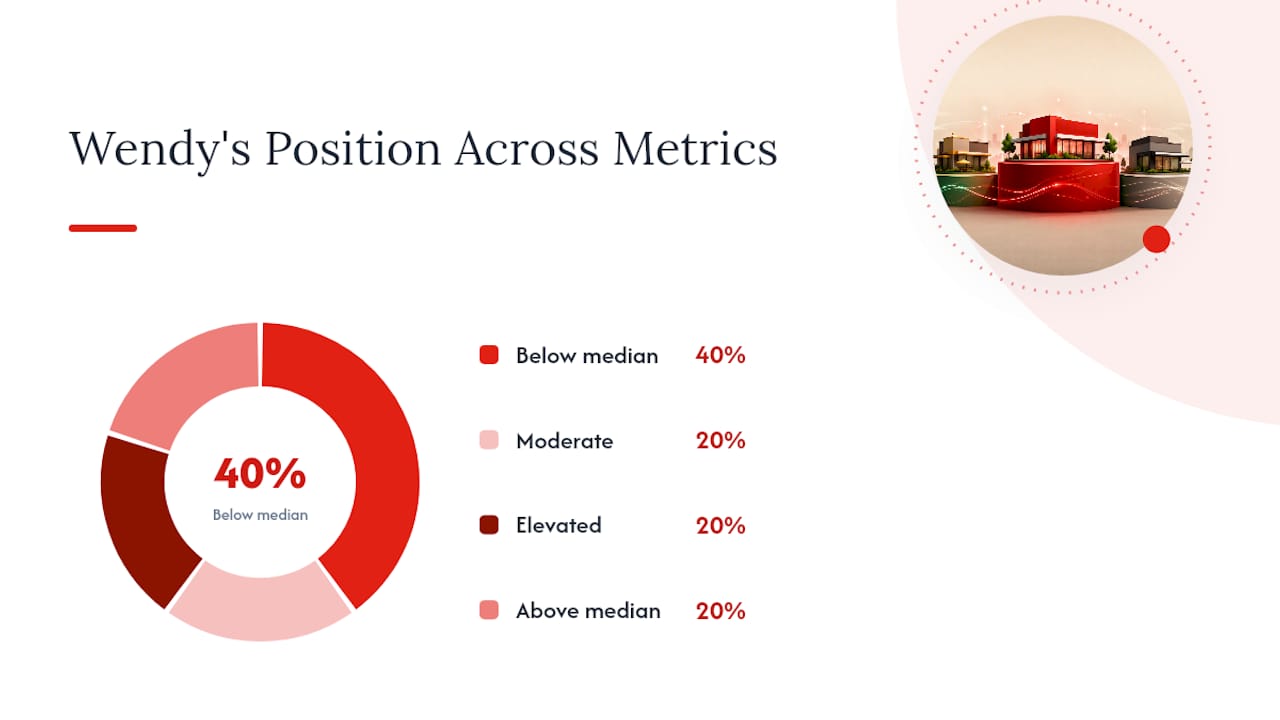
Screens comparing Wendy’s against curated peers consistently show it trading below both EV/EBITDA and P/E medians, and Simply Wall St’s ratio work confirms a similar gap on P/E and P/FCF.
Two things stand out beyond the headline discount:
- Chipotle’s corporate-owned, high-growth model commands a valuation premium that has nothing to do with franchising economics. It reflects unit growth and margin expansion, and it is not a fair comparison bucket for Wendy’s.
- Jack in the Box trades cheap for different reasons than Wendy’s, mainly leverage and a smaller, less consistent unit base. Grouping it with Wendy’s as “cheap peers” without adjusting for that would be a mistake.
How Do You Normalize Multiples Across Different Business Models?
Raw multiples mislead unless you adjust for the mechanics behind them first. Here is the sequence that produces a defensible comparison:
- Convert everything to EV/EBITDA first. It is the only multiple in this group that survives differing leverage and depreciation policy intact.
- Adjust for franchise mix. A chain near 95% franchised deserves a structurally higher multiple than one running half its stores corporately, all else equal, because royalty income carries less operating risk.
- Correct for average unit volume (AUV) and operating margin. Two chains with identical franchise mix but different AUV are not interchangeable. Higher AUV usually signals stronger real estate and demand, which supports a richer multiple.
- Layer in net debt/EBITDA before drawing conclusions on implied equity value. A discounted EV/EBITDA multiple sitting on top of elevated leverage is not the same discount as one sitting on a clean balance sheet.
The Wendy’s competitive analysis reinforces a practical shortcut: build sub-peer groups instead of measuring against mega-cap franchisors. Grouping Wendy’s with McDonald’s and Yum! Brands overstates the discount, since those two operate at a scale and margin profile Wendy’s does not match. A franchisor-versus-corporate-operator bucket approach, or a mid-market sub-peer set, produces a fairer read.
Pro Tip: Run the same normalization exercise on Jack in the Box before assuming Wendy’s discount and Jack’s discount mean the same thing. They rarely do.
What Happens to Wendy’s Valuation Under Different Scenarios?
Scenario modeling turns a static multiple comparison into something you can actually size a position against. Here is a simplified three-case structure analysts commonly build:
- Base case: Apply current reported EBITDA against the prevailing EV/EBITDA multiple. This anchors the “as-is” valuation and matches what peer-based valuation models currently imply as a reasonable fair value range.
- Bull case: Model modest same-store sales recovery plus partial multiple reversion toward the franchised-peer median. Even a small re-rating compounds meaningfully on a discounted starting multiple.
- Bear case: Model EBITDA contraction from sustained traffic softness or margin pressure, holding the multiple flat or compressing it further given the leverage overhang.
The spread between these three outputs is the real signal, not any single number in isolation. A stock that looks cheap in the base case but collapses in the bear case because of leverage sensitivity is a very different risk profile than one that stays reasonably valued across all three. Elevated free cash flow yields can mask that balance-sheet risk, which is exactly why stress-testing EBITDA and leverage together matters more than trusting yield alone. Use the scenario spread, not the headline multiple, to decide position size.
Where the Numbers Come From and Where They Fall Short
This comparison draws on relative-valuation screens, peer-comparison tools, and industry-level benchmarking rather than a single proprietary model.
- Peer multiple data comes from screens that update regularly but can lag real-time price moves by days.
- Franchise mix and AUV figures come from company disclosures, which report quarterly and carry inherent reporting lag versus live trading multiples.
- Industry-wide margin and multiple ranges come from IBISWorld’s fast-food industry benchmarking, which is useful for sanity-checking outliers but needs adjustment for brand-specific digital penetration and AUV.
Peer selection favored companies matching Wendy’s on franchise mix and scale rather than sheer market capitalization, which is why Chipotle and McDonald’s appear here as contrast points rather than direct comps.
Industry-level benchmarks are a sanity check, not a substitute for brand-specific adjustment. A multiple that looks normal against the broader fast-food industry can still be wrong for a specific chain’s AUV and digital mix.
Free Cash Flow Yield and What It Tells You About the Dividend
Wendy’s free cash flow yield sits meaningfully above several large-cap peers, which is the metric dividend-focused investors usually cite first when making the value case. A higher yield generally means more cash generated per dollar of enterprise value, and for a company paying a regular dividend, that cash flow is what actually funds the payout, not reported net income.
The catch is that yield alone does not tell you whether the dividend is safe. Net debt/EBITDA needs to sit in the conversation every time free cash flow yield comes up, because a chain carrying more leverage needs a larger share of its free cash flow directed toward debt service before any of it reaches shareholders. That is precisely the trade-off analyst commentary flags for Wendy’s: attractive FCF yield paired with a higher debt load than category leaders than most of its franchised peers carry.
Practically, this means an investor evaluating Wendy’s dividend should look at free cash flow after mandatory debt amortization and capital expenditure commitments, not headline FCF alone. Compare that adjusted figure to the dividend outlay. If the coverage ratio is comfortable even after debt service, the yield is a genuine value signal. If coverage tightens materially in a downside scenario, the yield is compensation for risk, not a free lunch. Readers modeling this themselves can start from Wendy’s free cash flow calculation to see how the components stack up quarter over quarter.
Adjusting for One-Time Items and Exceptional Expenses
Reported EBITDA and net income routinely include items that do not reflect ongoing operations: restructuring charges, impairments, refranchising gains or losses, and one-off legal settlements. Skipping this adjustment step is one of the most common ways an EV/EBITDA comparison across QSRs goes wrong.
Wendy’s, like most large restaurant chains, periodically records charges tied to store closures, system modernization costs, or refranchising transactions where company-owned units convert to franchised ones. These transactions can temporarily depress or inflate EBITDA in a way that has nothing to do with underlying unit economics. A refranchising gain, for instance, can make a quarter’s EBITDA look stronger even though it reflects a one-time accounting event rather than recurring royalty income.
The fix is straightforward in principle, harder in practice: strip out the non-recurring items management identifies in its adjusted EBITDA reconciliation, and cross-check that the exclusions are reasonable rather than a way to flatter results. Chains under margin pressure sometimes stretch what counts as “non-recurring,” so a healthy skepticism toward management’s own adjusted figures serves an analyst better than accepting them at face value. When comparing normalized EV/EBITDA across McDonald’s, Yum! Brands, Restaurant Brands International, Jack in the Box, Chipotle, and Wendy’s, use each company’s own reconciliation table as the starting point, then apply a consistent standard for what qualifies as one-time across all six names rather than trusting each company’s individual definition.
How Are Industry Trends and Macro Conditions Reshaping QSR Multiples?
Labor cost inflation, persistent value-menu competition, and slower discretionary spending among lower-income consumers have pressured same-store sales across the category, and that pressure shows up directly in valuation multiples. Chains most exposed to value-seeking customers, Wendy’s and Jack in the Box among them, have felt more comp softness than premium-positioned names like Chipotle.
Interest rate levels matter more for this industry than headlines suggest, because so much of QSR capital structure runs through franchisee financing and corporate debt used for buybacks or refranchising activity. A company carrying elevated net debt/EBITDA, Wendy’s case among the peer set here, sees its equity valuation more sensitive to rate moves than a lower-leverage franchisor.
Digital ordering and AI-driven drive-thru technology have become a genuine differentiator rather than a marketing talking point. Systems like Wendy’s FreshAI aim to cut order times and improve accuracy, which feeds directly into unit-level margin and, eventually, into how the market prices growth durability. Investors tracking this trend can review how AI automation is reshaping fast food operations for a fuller picture of where the category is headed.

Refranchising activity across the industry, shifting more company-owned units toward the franchise model, has also nudged margin profiles higher for several chains simultaneously, which partly explains why franchise-mix normalization matters more now than it did a decade ago.
How Do Growth Prospects Change the Multiple You Should Pay?
Growth expectations explain a large share of the multiple spread across this peer set, arguably more than franchise mix alone. Chipotle trades at a rich premium because the market is pricing sustained unit growth and margin expansion, not because its business model resembles a royalty-collecting franchisor. McDonald’s and Yum! Brands earn premium multiples partly from scale and partly from consistent, low-volatility same-store sales growth across a global footprint that diversifies regional weakness.
Wendy’s growth story centers more on operational efficiency, including AI-driven drive-thru initiatives and menu innovation, than on aggressive new-unit expansion. That is a legitimate strategy, but the market tends to reward unit growth and comp acceleration with a higher multiple than it rewards margin optimization on a stable store base. Restaurant Brands International sits in between: solid international unit growth offset by comp inconsistency across its Burger King and Tim Hortons banners.
Market positioning matters just as much as growth rate. A chain with strong brand loyalty in a defensible price tier, Chipotle’s fast-casual positioning being the clearest example, can sustain a premium multiple even through a slower growth quarter, because investors trust the long-term trajectory. Wendy’s positioning in the value-to-mid-tier segment means its multiple stays more sensitive to near-term comp results than a name with a stronger structural growth narrative. That sensitivity is part of why the current discount exists and part of why it could close quickly if comps inflect positively.
Wendy’s Franchise Economics Are the Real Story Behind the Discount
The valuation gap here is not a market mistake waiting to be corrected. It is the market pricing two specific risks: leverage and comp momentum. Conviction on Wendy’s improves meaningfully once you separate those two risks from the underlying franchise economics, which remain sound: high-margin royalty income, asset-light unit growth, and a drive-thru technology initiative that could support margin over time. That is why BuyWendy’s analysis stays anchored to franchise cash flow and leverage trends rather than headline multiples alone. Readers who want the full model behind these numbers can work through the Wendy’s fundamental analysis report for the underlying assumptions.
Run Your Own Scenarios With BuyWendy’s Valuation Model
Buywendys gives you the downloadable version of the scenario framework used in this article, built specifically around Wendy’s franchise economics rather than a generic restaurant template. The Wendy’s stock bull vs. bear case report includes the multiple re-rating scenarios, EBITDA sensitivity tables, and leverage stress tests you would otherwise need to build from scratch across six separate company filings.
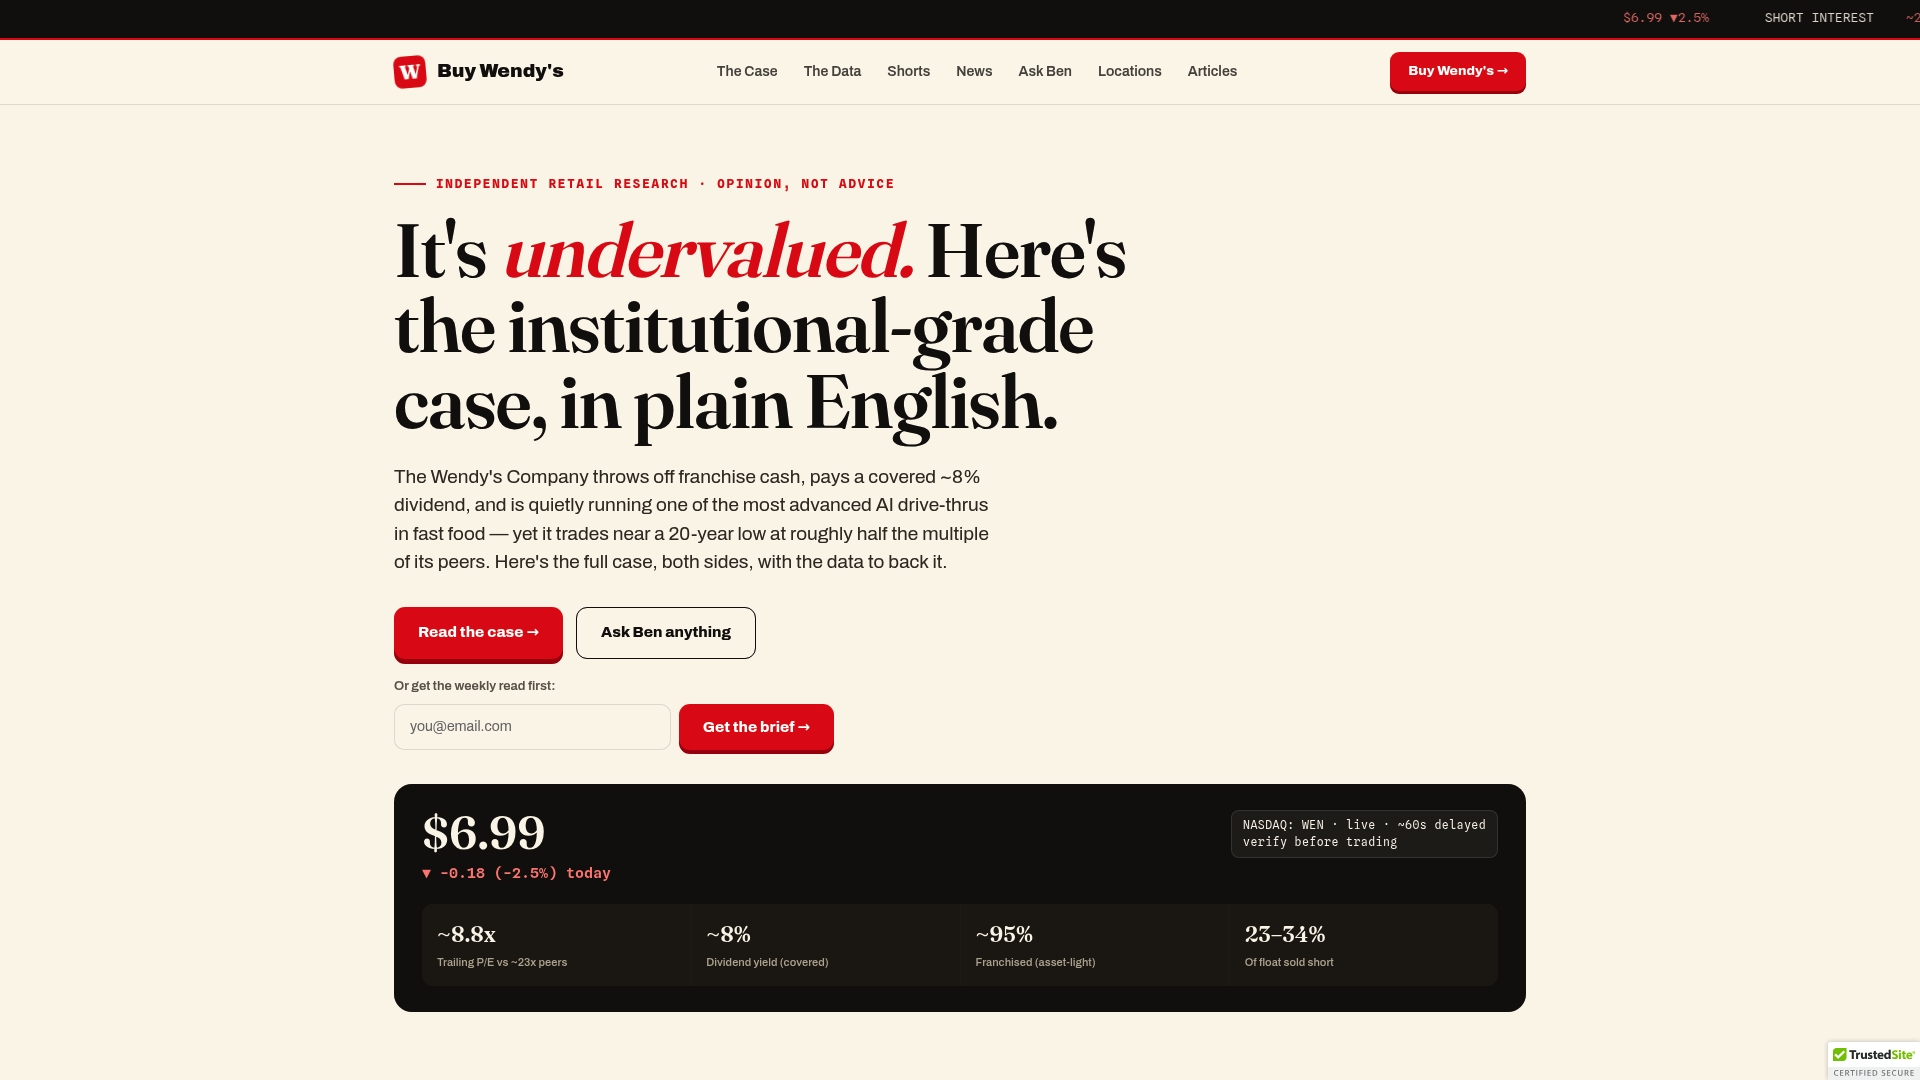
The model updates on a regular schedule as new quarterly data lands, so the inputs behind your EV/EBITDA and FCF yield checks stay current instead of stale. If you’re weighing a position sized on the scenario spread described above, download the bull vs. bear report and plug in your own leverage assumptions before you commit capital.
Sources
- Investing
- Is WEN Undervalued? The Wendy’s Company Relative Valuation 2026 | VCP Scanner
- Global Fast Food Restaurants industry report – IBISWorld
Recommended
- Wendy’s Quarterly Earnings Breakdown: A 2026 Guide
- Wendy’s Quarterly Earnings Breakdown: A 2026 Guide – Buy Wendy’s
- Wendy’s Q2 2026 Earnings Preview: The Scorecard That Separates a Real Turnaround From a Meme Rally – Buy Wendy’s
- The Setup: Wendy’s Reports Q2 2026 on August 7, and the Bar Is Historically Low – Buy Wendy’s