
QSR labor turnover runs at 130% or above annually across the sector. This means Wendy’s franchisees are replacing their entire hourly workforce roughly every nine months. For investors in WEN (NASDAQ), that churn rate is not an HR footnote. It is a direct pressure on unit-level EBITDA, a drag on the royalty base that funds corporate free cash flow, and a leading indicator of same-store sales risk. Wendy’s FreshAI drive-thru initiative and the Buywendys July 2026 Job Posting Analysis both offer measurable signals that let investors track whether the system is improving or deteriorating before it shows up in quarterly earnings.
Immediate signals to monitor:
- Hourly turnover rate at the unit level (target: below 100%; red flag: above 130%)
- First-90-day attrition, which drives the majority of labor-cost inflation in QSR
- General manager (GM) churn, a leading indicator of franchisee operational stability
- Job-posting velocity from the Buywendys Hiring Index as a proxy for net staffing gaps
- FreshAI rollout pace, which affects the labor-hours-per-transaction baseline
Table of Contents
- What does QSR labor turnover actually measure?
- Why does staff turnover in quick service hit Wendy’s financials so hard?
- How can investors measure Wendy’s turnover from public data?
- What operational factors drive hourly turnover at Wendy’s units?
- Which mitigation strategies offer the best ROI for Wendy’s operators?
- How does a turnover change flow to unit EBITDA and corporate free cash flow?
- What should investors watch in Wendy’s filings and earnings calls?
- Key Takeaways
- Turnover risk is the most underpriced operational variable in Wendy’s valuation
- Buywendys gives investors the turnover models that filings don’t
- Sources and further reading
What does QSR labor turnover actually measure?
The standard formula is straightforward: divide total separations in a period by average headcount, then annualize. A unit with 25 employees that processes 30 separations in a year carries a 120% turnover rate. Hires per open position adds a second dimension, capturing how hard it is to backfill each exit.
| Metric | Formula | Investor Use |
|---|---|---|
| Annual turnover rate | Separations ÷ avg. headcount | Baseline cost driver |
| First-90-day attrition | Exits within 90 days ÷ total hires | Onboarding efficiency signal |
| GM churn rate | GM separations ÷ total GM positions | Franchisee stability proxy |
| Hires per opening | Total hires ÷ open positions filled | Labor market tightness |
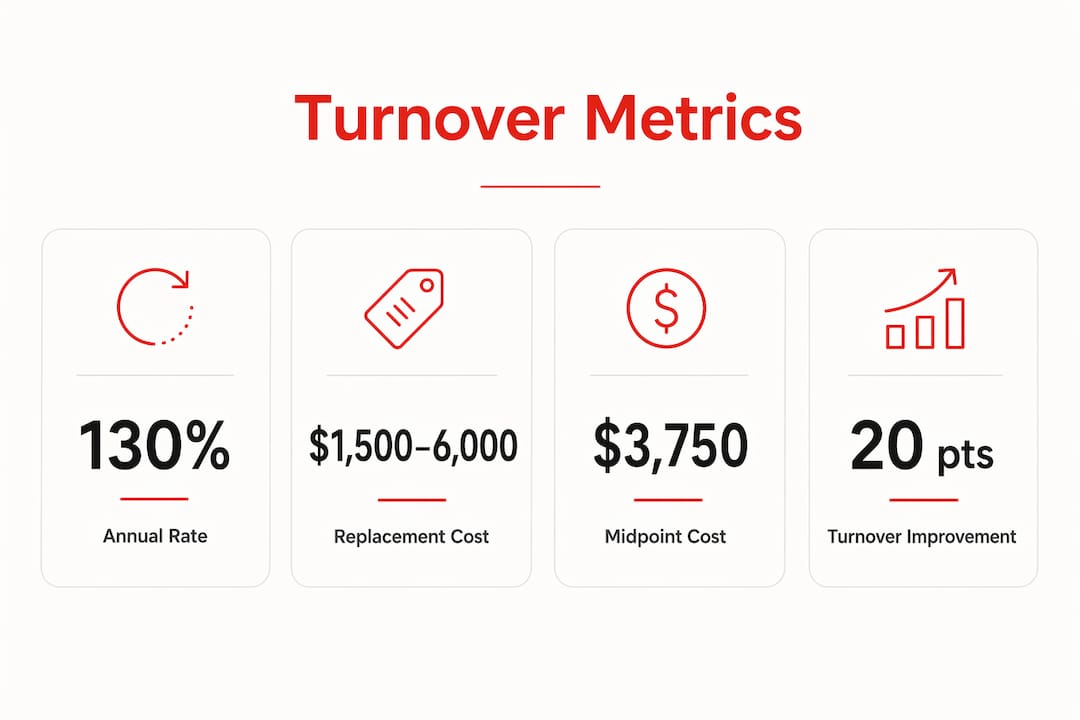
Industry benchmarks from DailyPay’s sector analysis place QSR annual turnover at 130% or above, with limited-service restaurants ranging from 123%–144%. A rate below 80% is generally considered good; below 50% is excellent. The QSR sector consistently sits well above both thresholds.
Seasonality matters. Summer and back-to-school periods (June–September) typically drive the highest separation volumes as student workers exit. The first 30 days and the 60–90 day window are the two highest-risk tenure buckets. An operator who loses an employee at day 45 has absorbed nearly all onboarding cost and recovered almost none of the productivity investment.
Why does staff turnover in quick service hit Wendy’s financials so hard?
Wendy’s derives roughly 95% of its system revenue from franchised units, collecting royalties as a percentage of franchisee sales. When turnover depresses franchisee sales, the royalty base contracts. The transmission mechanism runs through three channels.
Direct cost buckets per unit:
- Recruiting and screening: advertising, time-to-fill labor, background checks
- Training: structured onboarding hours, trainer wages, product waste during learning curves
- Productivity loss: a new crew member typically operates at 60%–70% of a tenured employee’s throughput for the first several weeks
- Manager distraction: GMs pulled into constant hiring cycles have less bandwidth for sales-building and customer experience initiatives
Replacing a single hourly employee costs between $1,500 and $6,000 when all indirect costs are included. For a 25-person unit running 130% annual turnover, that translates to roughly 33 replacements per year. At a mid-range estimated cost per hire, the unit absorbs a substantial annual replacement spend, before accounting for the sales impact of chronic understaffing.
The National Restaurant Association documents that being down even one employee can cost hundreds of dollars per shift in lost throughput and delayed training. Scaled across Wendy’s roughly 5,900 franchised units, a system-wide deterioration in turnover of 20 percentage points could represent a material drag on aggregate royalty-eligible sales.

How can investors measure Wendy’s turnover from public data?
No single public filing discloses unit-level hourly turnover for Wendy’s. Investors need to triangulate from multiple sources.
Primary and proxy data sources:
- Wendy’s 10-K: labor cost as a percentage of company-operated restaurant sales; commentary on wage inflation and staffing challenges in the MD&A section
- Franchise Disclosure Document (FDD): Item 19 financial performance representations; franchisee-level sales and cost structures
- Buywendys July 2026 Job Posting Analysis: proprietary index tracking job-posting velocity by market, a leading indicator of net staffing gaps and local labor tightness
- BLS Quarterly Census of Employment and Wages: sector-level hires and separations for NAICS 722 (food services)
- Glassdoor and Indeed: manager quality ratings and scheduling satisfaction scores as sentiment proxies
- Drive-thru throughput: order speed and service time data (where disclosed) as an operational proxy for crew adequacy
Pro Tip: Job-posting velocity tends to lead earnings surprises by one to two quarters. A sustained spike in Wendy’s open hourly positions in a given region, visible in the Buywendys Hiring Index, often precedes a same-store sales miss in that market before management addresses it on a call.
FreshAI complicates these proxy relationships going forward. As the AI drive-thru system handles order-taking, the labor-hours-per-transaction metric shifts, and raw headcount data becomes a less reliable proxy for operational capacity. Investors modeling FreshAI’s productivity impact should adjust their turnover-to-sales sensitivity assumptions accordingly.
What operational factors drive hourly turnover at Wendy’s units?
Scheduling predictability consistently ranks above wages in exit surveys as a driver of QSR separations. Workers who cannot plan their personal finances or childcare around a variable schedule leave, regardless of hourly pay. Manager quality amplifies this: a poor GM who schedules erratically and provides inconsistent feedback creates a unit-level turnover rate that can run 30–40 percentage points above the system average.
Wage compression is a secondary but real factor. When minimum wage floors rise faster than a franchisee’s ability to raise prices, the spread between entry-level and experienced-worker pay narrows, reducing the financial incentive to stay past the first 90 days.
Investor-observable red flags:
- GM churn rate above 40% in a given market cluster
- Time-to-fill for hourly positions exceeding three weeks (visible in job-posting duration data)
- Job-posting counts rising faster than unit count growth (net staffing gap signal)
- Early-tenure separation language appearing in franchisee commentary or FDD updates
One pattern worth flagging: the “low-hire, low-fire” dynamic, where operators suppress both hiring and firing to manage short-term labor costs. This can produce a deceptively stable turnover rate while masking burnout and disengagement that eventually triggers a sudden mass exit. Investors should treat an unusually low turnover figure alongside declining same-store sales as a potential leading indicator of a coming operational deterioration, not a sign of health.
Pro Tip: On earnings calls, listen for management language around “staffing levels” and “crew hours per transaction.” These phrases often signal that turnover pressure is affecting throughput before it appears in the labor cost line.
Which mitigation strategies offer the best ROI for Wendy’s operators?
Top QSR operators have shifted from reactive hiring to building stable multi-channel pipelines, combining structured onboarding, AI scheduling, and legal workforce programs such as EB-3 visa sponsorship for permanent resident workers.
Key interventions and their investor-relevant mechanics:
- Structured onboarding: Programs costing $500–$1,500 per employee that use progressive skill-building and milestone check-ins materially reduce first-90-day exits. The ROI is positive if the program retains even one employee who would otherwise have left before the 90-day mark.
- AI scheduling: Predictive scheduling tools reduce last-minute shift changes, the single most cited non-wage driver of voluntary exits. Investors can model this as a reduction in first-30-day separations.
- FreshAI: By automating order-taking, Wendy’s FreshAI system reduces the cognitive load on drive-thru crew, which lowers one of the highest-stress roles in the unit. The reasonable investor expectation is a modest reduction in drive-thru-specific attrition over a 12–24 month rollout horizon, not an immediate step-change.
- Gamification and development pathways: Non-wage retention levers with measurable ROI in operator case studies, particularly for workers in the 18–25 age cohort who respond to visible career progression.
- EB-3 and legal workforce programs: Provide a more stable, longer-tenure labor pool for operators in tight labor markets, reducing the structural churn driven by a transient young workforce.
How does a turnover change flow to unit EBITDA and corporate free cash flow?
The sensitivity below uses conservative, sourced assumptions. Replacement cost per hire: $3,750 (midpoint of the $1,500–$6,000 range). Unit crew size: 25. Royalty rate: 5% of net sales. Baseline turnover: 130%.
| Turnover Reduction | Fewer Replacements/Unit/Year | Savings/Unit/Year | EBITDA Impact/Unit | Royalty Impact/Unit | System FCF Impact (5,900 units) |
|---|---|---|---|---|---|
| 10 pp (130% → 120%) | — | — | — | Indirect via sales | — |
| 20 pp (130% → 110%) | — | — | — | Indirect via sales | — |
| 40 pp (130% → 90%) | — | — | — | Indirect via sales | — |
The royalty transmission is indirect: lower turnover reduces understaffing, which supports throughput and same-store sales, which expands the royalty base. A 1% lift in system-wide same-store sales at Wendy’s current revenue base translates to a meaningful royalty increment. Investors should model the sales-recovery component separately using the Wendy’s quarterly earnings breakdown as the baseline.
A 20 percentage-point improvement becomes material to EPS when it is sustained across a majority of the system for two or more consecutive quarters. The payback period for a $1,000-per-employee onboarding investment is typically under six months at current replacement cost levels.
What should investors watch in Wendy’s filings and earnings calls?
Filing items and KPIs to flag
- 10-K, Item 7 (MD&A): Labor cost as a percentage of company-operated restaurant sales; any year-over-year commentary on wage inflation, staffing challenges, or training spend
- 10-K, Item 1A (Risk Factors): Language around labor availability, minimum wage legislation, and workforce retention
- FDD, Item 19: Franchisee-level sales and cost data; changes in labor cost percentages across disclosure years
- Earnings call transcripts: Mentions of “crew hours,” “staffing levels,” “labor productivity,” or “training investment”
- Buywendys Hiring Index: Month-over-month job-posting velocity by market as a leading indicator
Management questions investors should ask
- “How has FreshAI deployment affected labor hours per transaction at fully rolled-out units?”
- “What portion of unit-level wage inflation was offset by productivity gains in the most recent quarter?”
- “Can you quantify GM turnover trends across the franchise system over the past 12 months?”
- “How does first-90-day attrition compare to the prior year, and what specific programs are franchisees deploying to address it?”
Red flag checklist:
- Labor cost as % of sales rising more than 100 basis points year-over-year without a corresponding wage-floor explanation
- Management declining to quantify staffing levels or deflecting turnover questions to “franchisee responsibility”
- Job-posting velocity in the Buywendys Hiring Index accelerating in multiple markets simultaneously
- Low-hire, low-fire signals appearing alongside flat or declining same-store sales
Key Takeaways
QSR labor turnover running at 130% or above at Wendy’s franchised units creates a direct, quantifiable drag on unit EBITDA and an indirect but material risk to the royalty base that drives corporate free cash flow.
| Point | Details |
|---|---|
| Baseline turnover assumption | Model 130% or above annual turnover for Wendy’s units; flag any sustained move above 144% as a risk escalation. |
| Replacement cost per hire | Use $1,500–$6,000 per hourly employee; $3,750 midpoint is a defensible base case for sensitivity work. |
| First-90-day attrition priority | Early exits drive the majority of labor-cost inflation; onboarding investment at $500–$1,500 per employee is ROI-positive. |
| FreshAI as a mitigation signal | Track FreshAI rollout pace and labor-hours-per-transaction disclosures as leading indicators of structural turnover improvement. |
| Buywendys as a leading indicator | The Buywendys July 2026 Job Posting Analysis tracks hiring velocity by market, providing a 1–2 quarter lead on same-store sales risk. |
Turnover risk is the most underpriced operational variable in Wendy’s valuation
Most sell-side models for Wendy’s (NASDAQ: WEN) treat labor cost as a relatively stable percentage of sales, adjusting it mechanically for minimum wage changes. That framing misses the more important variable: the velocity of workforce replacement and its compounding effect on unit productivity, franchisee profitability, and ultimately the royalty stream that underpins Wendy’s asset-light investment case.
The sector data is unambiguous. QSR turnover exceeds 100% annually as a structural feature of the labor model rather than a correctable management failure. The investor question is not whether Wendy’s faces this challenge, but whether the system is managing it better or worse than the sector average, and whether FreshAI’s automation of the highest-attrition role in the unit (drive-thru order-taker) is creating a durable productivity advantage.
The Buywendys July 2026 Job Posting Analysis is the most granular public-facing tool for tracking this in near real time. Paired with 10-K labor cost disclosures and FDD Item 19 comparisons, it gives investors a three-source triangulation that no single filing provides on its own. The sensitivity math in this article is deliberately conservative. Even a 10 percentage-point reduction in system-wide turnover, sustained for two quarters, produces unit-level savings that are large enough to show up in franchisee reinvestment rates and, eventually, in the royalty base.
Buywendys gives investors the turnover models that filings don’t
Wendy’s SEC filings tell you what labor cost was. Buywendys tells you where it is heading. The Wendy’s Stock Valuation Model Guide includes a pre-built sensitivity framework that lets you plug in your own turnover assumptions and see the direct effect on unit EBITDA, royalty revenue, and corporate free cash flow, without building the model from scratch.
The July 2026 Job Posting Analysis is already live on the platform, tracking hiring velocity across Wendy’s markets as a leading indicator of staffing gaps. For investors who want the complete picture, the Wendy’s Free Cash Flow guide walks through how to translate unit-level labor changes into consolidated FCF assumptions. Start with the valuation model to see exactly how a 20 percentage-point improvement in turnover moves the needle on WEN’s intrinsic value.
Sources and further reading
Industry benchmarks and sector data:
- VantaInsights: Restaurant Employee Turnover Rate Benchmarks 2026
- DailyPay: QSR and Restaurant Turnover Rates
- QSR Pro: Why QSR Employee Retention Programs Keep Failing
- QSR Pro: The Complete Guide to QSR Employee Retention in 2026
- QSR Magazine: Chipotle’s Hourly Turnover Climbed to 155 Percent in 2025
Workforce research and white papers:
- Fountain: 2025 QSR Workforce Snapshot
- National Restaurant Association: Hiring & Staffing Research Insight
- QSR Magazine: Beyond Filling Positions
- QSR Web: How Low-Hire, Low-Fire Puts QSR Employee Experience in the Hot Seat
Buywendys proprietary resources (investor-grade analysis):
- Wendy’s Hiring Index: July 2026 Job Posting Analysis (proprietary)
- Wendy’s Quarterly Earnings Breakdown (proprietary)
- FreshAI Definitive Guide (proprietary)
SEC filings and franchise disclosures (public):
- Wendy’s 10-K Annual Report (EDGAR, NASDAQ: WEN): Items 1A, 7, and financial statements
- Wendy’s Franchise Disclosure Document: Item 19 (financial performance representations)
This article is general informational analysis, not investment or financial advice. Investors should verify current figures with primary sources and consult a qualified financial professional for their specific situation.