
Table of Contents
- Executive Summary: What It Means to Build a Stock Bull Case
- Why Building a Formal Bull Case Matters for Your Investment Thesis
- Understanding the Investment Thesis Framework
- Fundamental Analysis for Stocks: Building Your Research Foundation
- Competitive Moat Analysis: Identifying Sustainable Advantages
- Scenario Analysis Investing: Building Multiple Outcome Paths
- Identifying Key Assumptions and Swing Factors
- Avoiding Confirmation Bias and Psychological Pitfalls
- Valuation Models and Intrinsic Value Estimation
- Building an Exit Strategy Into Your Bull Case
How to Build a Stock Bull Case: A Step-by-Step Framework
Last Updated: July 28, 2026
Executive Summary: What It Means to Build a Stock Bull Case
Learning how to build a stock bull case is essential for any investor who wants to move beyond gut feelings and emotional decision-making. A bull case isn’t optimism dressed up as analysis, it’s a structured argument for why a company’s stock is undervalued relative to its intrinsic value and future growth potential. This framework walks you through constructing a compelling bull case from first principles, identifying key assumptions, weighing probability scenarios, and protecting yourself from cognitive biases that derail countless investors every year.
Why Building a Formal Bull Case Matters for Your Investment Thesis
Successful investing requires more than hope. Many investors buy stocks based on a tip, a headline, or a vague sense that a company "seems cheap." A structured bull case forces you to articulate exactly why you believe in a stock and when you should stop believing in it.
A formal bull case serves three critical functions. First, it clarifies your reasoning before you commit capital, reducing regret-driven decisions later. Second, it creates a monitoring framework: you define key assumptions, then track them over time. If assumptions break down, you have a predetermined exit trigger rather than waiting for a 50% loss. Third, it inoculates you against confirmation bias by forcing you to engage with contradictory evidence.
The difference between a thesis and a guess is documentation. Write it down. Assign probabilities. Name your swing factors. This is the difference between deliberate investing and accidental gambling.
Understanding the Investment Thesis Framework
Your investment thesis answers a single question: Why does this company’s stock offer attractive risk-adjusted returns from here? A thesis isn’t a price prediction, it’s a reasoned argument about value creation, competitive position, and margin of safety.
Bull Case vs. Bear Case: The Dual-Thesis Approach
A mature investor builds both a bull case and a bear case for every significant position. The bull case articulates your upside scenario where the company executes well and the market recognizes its value. The bear case articulates the downside scenario where execution falters, competition intensifies, or the market reprices lower.
This dual-thesis approach prevents you from falling in love with a stock. When you articulate a credible bear case, you confront real risks instead of dismissing them.
A strong bull case typically includes:
- Valuation anchor: Current price vs. estimated intrinsic value
- Growth drivers: Revenue growth sources and sustainability
- Margin expansion: How profitability improves over time
- Competitive moat: What prevents competitors from eroding returns
- Capital allocation: How management deploys cash
- Catalysts: Events that could trigger market recognition of value
The Role of Probability Weighting in Your Thesis
Assigning probabilities to different scenarios forces intellectual honesty. You’re not predicting the future, you’re assigning rough odds to different outcome paths based on historical precedent, management execution, and competitive dynamics.
If your base case has a 50% probability, your bull case might have 25% and your bear case 25%. These numbers should sum to 100%. This framework prevents overconfidence: if your bull case has only a 25% probability, that tells you the stock is highly speculative and you should size your position accordingly.
Fundamental Analysis for Stocks: Building Your Research Foundation
A bull case rests on fundamental analysis, the systematic study of a company’s financial statements, competitive position, and growth prospects.
Earnings Reports and Revenue Growth Metrics
Start with the income statement. Revenue growth is the foundation of every bull case. A company growing revenue faster than peers is either taking market share or operating in a growing market, both bullish signals.
Organic revenue growth (from existing operations, excluding acquisitions) is more sustainable than acquisition-driven growth. Look at the last three to five years. Is growth accelerating, stable, or decelerating? Accelerating growth often signals a company hitting its stride. Decelerating growth often signals maturity or headwinds.
Pay attention to revenue per customer, customer acquisition cost, and retention rates. These metrics reveal whether a company is building a sustainable growth engine or burning cash to chase growth. For restaurant operators and franchisors, comparable-store sales growth and unit economics are critical indicators of operational health.
Margin Expansion and Capital Allocation Patterns
Margins matter more than revenue growth. A company growing revenue at 20% with flat margins is often a value trap. A company growing revenue at 10% while expanding margins is often undervalued.
Examine gross margin, operating margin, and net margin. Look for trends. Is the company expanding margins as it scales? This suggests operating leverage. Is it maintaining margins while investing in growth? This suggests disciplined capital allocation.
Capital allocation reveals management quality. Does the company invest in R&D and maintain competitive advantage? Does it return cash to shareholders through dividends or buybacks? A management team that deploys capital wisely is more likely to execute on a bull case. For restaurant companies, this includes decisions about technology investment, restaurant remodels, and franchise support.
Competitive Moat Analysis: Identifying Sustainable Advantages
A bull case isn’t just about current profitability, it’s about whether that profitability is defensible. Companies with strong competitive moats can maintain high returns on capital for years.
Defining and Measuring Your Company’s Competitive Moat
A competitive moat is a durable advantage that prevents competitors from eroding market position. Five types exist: brand strength, switching costs, network effects, cost advantages, and regulatory advantages.
Brand strength protects companies like Apple and Nike. Switching costs protect companies like Salesforce and Adobe. Network effects protect companies like Facebook and Visa. Cost advantages protect companies like Costco. Regulatory advantages protect utilities and pharmaceutical patent holders.
Measure moat strength by examining return on invested capital (ROIC) relative to the cost of capital. A company with ROIC of 15% and cost of capital of 8% has a strong moat. A company with ROIC of 8% and cost of capital of 8% has no moat.
Assessing Threat Level to Long-Term Competitive Position
Every moat erodes eventually. Ask three questions: Are new competitors entering the market? Are existing competitors gaining share? Is technology disrupting the competitive advantage?
Technology disruption is often the most dangerous threat. Kodak had a strong moat in film photography, but digital photography destroyed it. Your bull case should explicitly address technological threats to the business model. For restaurant operators, this includes digital ordering capabilities, delivery partnerships, and customer data analytics.
Scenario Analysis Investing: Building Multiple Outcome Paths
Markets move through discrete scenarios, not continuous trajectories. A bull case should model three scenarios: base case, bull case, and bear case.
Base Case, Bull Case, and Bear Case Scenarios
Your base case represents the most likely outcome given current conditions. Revenue grows at a steady pace. Margins remain stable. Competition remains constant. This is your central estimate, not your best-case hope.
Your bull case represents an upside scenario where multiple things go right. Revenue growth accelerates. Margins expand. Competition weakens. Management executes exceptionally well. This scenario is plausible but less likely than the base case.
Your bear case represents a downside scenario where things go wrong. Revenue growth slows. Margins compress. A new competitor disrupts the market. Management makes strategic mistakes.
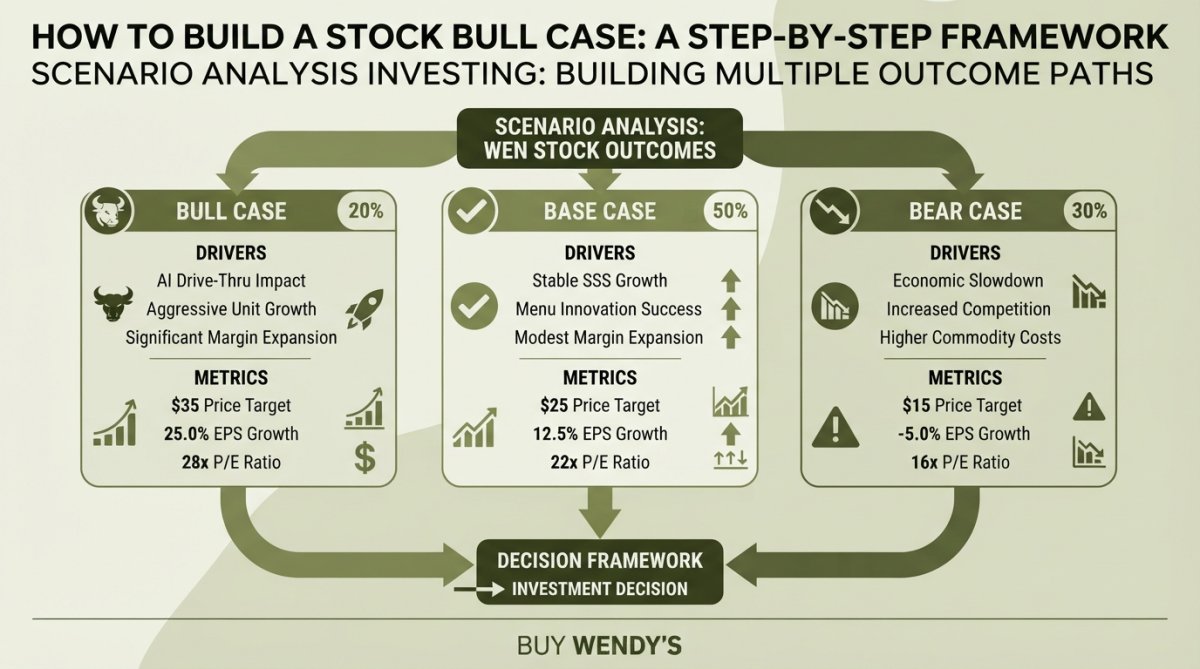
For each scenario, estimate the stock price at a future date (typically 2-3 years out). Use a valuation method like discounted cash flow, price-to-earnings multiples, or enterprise value-to-revenue multiples. The result is a range of potential outcomes.
Assigning Probability Weights to Each Scenario
Once you’ve modeled three scenarios, assign probabilities. A typical distribution might be: bear case 25%, base case 50%, bull case 25%. These probabilities should reflect your actual conviction.
Calculate an expected value by multiplying each scenario’s stock price by its probability and summing the results. This expected value represents your fair-value estimate. Compare it to the current stock price. If the current price is significantly below your expected value, the stock offers attractive risk-reward.
Identifying Key Assumptions and Swing Factors
Every bull case rests on assumptions. Some are critical; if they break, the bull case collapses. Others are peripheral.
What Assumptions Are Critical to Your Bull Case?
A swing factor is an assumption that, if wrong, would materially change your bull case. For a software company, it might be customer retention rates. For a retailer, it might be same-store sales growth. For a manufacturer, it might be input cost inflation.
Identify your top three to five swing factors. These are the assumptions you should monitor most closely. If they hold, your bull case remains intact. If they break, you should reconsider your position.
Building Your Monitoring Checklist
Create a quarterly monitoring checklist tied to your swing factors. What data points will you track? How often will you update them? What thresholds would trigger a reassessment?
A monitoring checklist might include:
- Customer retention: Track quarterly churn rate. Alert if it rises above 12%.
- Revenue growth: Track quarterly organic revenue growth. Alert if it slows below 8%.
- Gross margins: Track quarterly gross margins. Alert if they decline more than 100 basis points.
- Market share: Track annual market share estimates. Alert if competitors gain share.
- Capital expenditure: Track annual capex relative to revenue. Alert if it rises unexpectedly.
This checklist transforms your bull case from a static document into a living framework. You’re monitoring leading indicators that might signal trouble ahead. For restaurant stocks, this includes tracking same-store sales, unit growth, labor costs, and customer traffic metrics. Resources like Wendy’s News & Restaurant Tracker can help you monitor these operational metrics alongside financial performance.
Avoiding Confirmation Bias and Psychological Pitfalls
The biggest threat to a bull case isn’t the market, it’s your own mind. Confirmation bias is the tendency to seek information that confirms your beliefs while dismissing contradictory information.
Steelmanning the Bear Case
Steelmanning is constructing the strongest possible version of an opposing argument. If your bull case is correct, what would the best version of the bear case look like?
Don’t construct a straw man bear case that’s easy to dismiss. Construct a steel man bear case, the most compelling version of the argument against your position. This forces you to engage with real risks rather than dismiss them.
By steelmanning the bear case, you confront real vulnerabilities in your bull case. You might conclude that the risk is acceptable given the upside potential. But at least you’ve made that judgment consciously.
Beyond Confirmation Bias: Anchoring, Overconfidence, and Recency
Anchoring is relying too heavily on the first piece of information you encounter. If you first learned a stock traded at $50, you might anchor to that price and view $40 as cheap, even if fundamental analysis suggests $25 is fair value.
Overconfidence is overestimating your knowledge and predictive ability. Markets are complex. Unexpected events happen. A healthy bull case acknowledges uncertainty rather than projecting false certainty.
Recency bias is overweighting recent events. A company that just beat earnings might feel like a stronger bull case than it actually is. Recent performance is relevant, but it shouldn’t overwhelm fundamental analysis.
Counteract these biases by documenting your bull case before you buy, assigning explicit probabilities, and monitoring assumptions over time. When new information arrives, update your probabilities rationally rather than doubling down on your initial conviction.
Valuation Models and Intrinsic Value Estimation
A bull case requires a valuation anchor, an estimate of what the company is actually worth. Without one, you’re just guessing whether a stock is cheap or expensive.
Quantitative vs. Qualitative Weighting in Valuation
Most valuation models are quantitative. Discounted cash flow (DCF) models project future cash flows and discount them to present value. Price-to-earnings multiples compare stock price to earnings. Enterprise value-to-revenue multiples compare total value to revenue.
These quantitative models are essential, but they have limitations. They’re only as good as your assumptions about future growth, margins, and discount rates. Small changes in assumptions produce large changes in valuation.
Qualitative factors matter too. A company with strong management, a defensible moat, and a history of execution deserves a higher multiple than one with weak management, no moat, and underperformance.
A mature valuation approach weights both quantitative and qualitative factors. Use DCF and multiples analysis to establish a range of fair values. Then adjust based on qualitative factors. If the company has exceptional management and a strong moat, weight toward the higher end. If it faces intense competition, weight toward the lower end. For restaurant companies, qualitative factors include brand strength, franchise system health, and management’s track record of operational execution.
Risk-Reward Ratio and Upside/Downside Potential
Once you’ve estimated intrinsic value, compare it to the current stock price. The difference is your margin of safety.
If intrinsic value is $100 and the current price is $60, your margin of safety is 40%. If the stock rises to $100, you gain 67%. If it falls to $40, you lose 33%. Your risk-reward ratio is favorable.
Conversely, if intrinsic value is $100 and the current price is $95, your margin of safety is only 5%. If the stock rises to $100, you gain 5%. If it falls to $75, you lose 21%. Your risk-reward ratio is unfavorable.
A strong bull case has a favorable risk-reward ratio. You’re risking less than you stand to gain.
Building an Exit Strategy Into Your Bull Case
A bull case without an exit strategy is incomplete. You need predetermined rules for when to sell.
When to Reassess Your Investment Thesis
Reassess your bull case in three scenarios. First, when your swing factors break. Second, when the stock price reaches your target price. Third, when new information contradicts your bull case.
Reassessment doesn’t necessarily mean selling. It means updating your analysis with new information and deciding whether your bull case still holds. But at least you’ve made a conscious decision rather than holding by default.
Price Targets and Outperform/Underperform Triggers
Define explicit price targets for your bull case scenarios. Your bear case price target might be $60. Your base case price target might be $100. Your bull case price target might be $150.
Define triggers for when to reassess. If the stock reaches your bull case target, consider taking profits. If it falls below your bear case target without fundamental deterioration, consider adding. If it rises 20% without fundamental improvement, consider trimming.
| Scenario | Target Price | Action if Reached |
|---|---|---|
| Bear Case | $60 | Add if fundamentals intact |
| Base Case | $100 | Consider trimming 25% |
| Bull Case | $150 | Consider taking profits |
Key Takeaways
Building a stock bull case is a disciplined process, not a hopeful exercise. Start with fundamental analysis, understand revenue growth, margin dynamics, and competitive position. Model multiple scenarios and assign probabilities. Identify swing factors and build a monitoring checklist. Construct a steel man bear case to confront real risks. Estimate intrinsic value using both quantitative and qualitative factors. Define an exit strategy before you buy.
The best bull cases acknowledge uncertainty while articulating a compelling case for value creation. They’re documented, monitored, and reassessed regularly. They’re built to survive contact with reality, not collapse when the market disagrees.
At Buy Wendy’s, we believe that structured investment analysis, the kind that separates bull cases from bear cases, assigns probabilities to scenarios, and monitors swing factors, is the foundation of long-term wealth creation. Whether you’re analyzing Wendy’s stock or any other company, this framework applies. The discipline of building a rigorous bull case is what separates deliberate investors from accidental traders.
Frequently Asked Questions
What are the key components of a strong stock bull case?
A strong bull case includes: (1) a clear investment thesis with defined assumptions, (2) fundamental analysis showing revenue growth and margin expansion, (3) identification of competitive moat and long-term advantages, (4) scenario analysis with probability weighting, (5) valuation showing attractive risk-reward ratio, and (6) an explicit monitoring checklist for swing factors. The best cases integrate quantitative metrics with qualitative competitive insights and explicitly acknowledge the bear case.
How does building a formal investment thesis framework protect against confirmation bias?
A structured framework forces you to steelman the bear case upfront, assign explicit probabilities to different scenarios, and identify specific swing factors that could invalidate your thesis. By documenting assumptions before researching, you create accountability and reduce selective interpretation of data. Regularly reviewing your monitoring checklist against actual results helps catch when new evidence contradicts your original thesis, triggering reassessment rather than rationalization.
What is the difference between fundamental analysis and scenario analysis when building a bull case?
Fundamental analysis examines the company's current financials, competitive position, and earnings potential, answering 'what is this business worth today?' Scenario analysis builds multiple outcome paths (base, bull, bear) with probability weights, answering 'what could this business be worth under different conditions?' Together, they create a complete bull case: fundamentals justify the base case, scenario analysis quantifies upside potential and downside risk, and probability weighting prevents overconfidence in any single outcome.
How often should you update or reassess your stock bull case?
Review your bull case quarterly when companies report earnings, this is when new data on revenue growth, margins, and competitive position emerges. More frequently assess your swing factors and monitoring checklist for changes that might trigger a reassessment. If a key assumption is invalidated by new evidence, or if the risk-reward ratio shifts materially, revisit your entire thesis. Avoid constant updates driven by short-term price movements; focus on fundamental changes in the business or market sentiment that affect your long-term outlook.
[EXTERNAL_LINK: SEC Edgar filings and investor relations documents | sec.gov]
[EXTERNAL_LINK: Morningstar fundamental analysis and company research | morningstar.com]
[EXTERNAL_LINK: McKinsey research on competitive advantage and business strategy | mckinsey.com]
This article was written using GrandRanker