
Table of Contents
- Executive Summary: Fast Food Stocks to Watch
- Why Fast Food Stocks Matter to Retail Investors
- Key Metrics for Evaluating QSR Stocks
- Restaurant Industry Trends Reshaping Fast Food
- Digital Sales in Fast Food: Growth Driver or Plateau Risk
- Franchise Model Resilience in Economic Uncertainty
- Fast Food Stocks to Watch: Turnaround Plans and C-Suite Strategy
- Dividend Sustainability vs. Value Trap: What Investors Must Know
- Market Sentiment and Retail Investor Interest
- Key Takeaways
Fast Food Stocks to Watch in 2026: QSR Leaders
Last Updated: July 25, 2026
Executive Summary: Fast Food Stocks to Watch
The quick-service restaurant (QSR) sector is navigating a critical inflection point in 2026. Consumer spending patterns are shifting, franchise economics are under pressure from labor costs and commodity inflation, and digital transformation has become a competitive necessity rather than a luxury. For investors evaluating fast food stocks to watch, the challenge lies in distinguishing between temporary headwinds and structural decline, and identifying which operators have credible turnaround plans backed by operational improvements and technology investment.
At Buy Wendy’s, we track the financial health, strategic positioning, and market sentiment of major QSR players. This analysis covers the metrics that matter most to retail investors: cash flow sustainability, dividend safety, franchise model resilience, and the real impact of digital sales and AI-driven operational efficiency. Below, we’ll examine why fast food stocks to watch matter to individual investors, what separates winners from value traps, and how to evaluate turnaround plans with skepticism but not dismissal.
Why Fast Food Stocks Matter to Retail Investors
The fast food sector sits at the intersection of consumer discretionary spending, franchise economics, and technology transformation. These dynamics create both opportunity and risk for individual investors seeking exposure to restaurant stocks.
Fast food operators generate predictable cash flows through asset-light franchise models. The majority of revenue comes from franchisee royalties, rent, and service fees, not from operating restaurants directly. This structure creates high-margin, recurring income streams that support dividend payments. However, when franchisee unit economics deteriorate, system-wide traffic declines, or consumer spending contracts, the entire model faces pressure.
The sector also reflects real-time consumer health. Fast food traffic trends signal whether households are trading down from casual dining, cutting discretionary purchases, or pulling back entirely. Rising menu prices drive short-term margin expansion but risk traffic loss if pricing outpaces wage growth and consumer willingness to pay.
Digital sales and mobile ordering have fundamentally reshaped QSR operations. Operators investing in AI-driven drive-thru technology, personalized loyalty programs, and seamless mobile experiences are capturing market share and improving unit economics. Those lagging in digital transformation face structural headwinds.
Key Metrics for Evaluating QSR Stocks
Retail investors often rely on headline stock price and dividend yield, but these metrics mask the operational reality beneath. Here’s what actually matters when evaluating fast food stocks to watch.
Cash Flow and Dividend Sustainability
Free cash flow, not earnings, is the true measure of a QSR operator’s financial health. Franchisees pay royalties and rent in cash. Dividends require cash, not accounting profits.
Examine the following metrics:
- Operating cash flow: Does the company generate consistent cash from franchisee payments, or is cash flow volatile and dependent on one-time gains?
- Capital expenditure: QSR operators typically maintain low capex (2-4% of revenue) for company-operated stores and digital infrastructure. Capex creep signals operational distress or aggressive expansion.
- Free cash flow conversion: Healthy QSR operators convert 70-85% of operating cash flow into free cash flow. Below 60% suggests rising debt service, working capital stress, or unsustainable shareholder returns.
- Dividend payout ratio: A payout ratio above 80% of free cash flow leaves little room for debt reduction or reinvestment. Ratios above 100% signal an unsustainable dividend.
The critical question: Is the dividend supported by recurring operational cash flow, or is it propped up by asset sales, debt increases, or one-time gains? Investors holding fast food stocks to watch for income must answer this question first.
Margin Pressure and Menu Price Strategy
Menu price increases are a double-edged sword. Raising prices protects margins when input costs rise, but excessive pricing risks traffic loss, particularly among lower-income consumers who represent a disproportionate share of fast food traffic.
Track these metrics:
- Comparable store sales (comp sales): Same-store sales growth reveals whether price increases are driving nominal revenue growth or whether traffic is declining. Negative comps signal consumer resistance.
- Operating margins: Rising prices should expand operating margins (operating income as a percentage of revenue). Flat or declining margins despite price increases suggest traffic loss is offsetting price gains.
- Franchisee profitability: Rising menu prices only matter if franchisees can retain them. If franchisees are pressured to absorb higher labor costs and can’t pass them to customers, franchisee unit economics deteriorate, leading to store closures and reduced royalty payments to the franchisor.
The tension between pricing power and traffic preservation defines the QSR environment in 2026. Operators who price aggressively but lose traffic are winning the short-term margin battle while losing the long-term competitive war.
Restaurant Industry Trends Reshaping Fast Food
Consumer behavior and macro conditions are reshaping the fast food landscape in ways that differentiate winners from laggards.
Consumer Spending Cycles and Inflation Impact
Fast food traffic is highly sensitive to household purchasing power and consumer confidence. When real wages decline or unemployment rises, lower-income households shift to fast food from casual dining. When inflation erodes discretionary spending, even fast food traffic can decline.
The 2026 environment presents a mixed picture. Labor market strength has supported wage growth for lower-income workers, which typically supports fast food traffic. However, cumulative inflation in food commodities, labor, and rent has compressed franchisee margins. Operators are caught between the need to maintain pricing (to protect margins) and the risk of traffic loss if prices rise faster than consumer willingness to pay.
Macro sensitivity means fast food stocks to watch are particularly vulnerable to recession signals. A meaningful decline in consumer confidence or employment would likely trigger traffic declines that price increases cannot offset.
Fast Casual Competition and Market Segmentation
Fast casual operators (Chipotle, Panera, Shake Shack) have captured market share by positioning above traditional fast food on quality and customization while maintaining speed and convenience. This middle tier has fragmented the QSR market: premium-positioned fast casual competes with casual dining on quality, while value-oriented fast food competes on price and convenience.
Fast food operators face pressure from both directions. Premium consumers trade up to fast casual. Price-sensitive consumers remain in fast food but demand aggressive value positioning. Operators caught in the middle, neither premium enough to justify fast casual pricing nor cheap enough to dominate value, struggle.
Successful fast food chains in 2026 have clear positioning: either best-in-category value (aggressive pricing, high volume) or differentiated product quality and convenience (digital ordering, speed, customization). Operators without clear positioning face structural headwinds.
Digital Sales in Fast Food: Growth Driver or Plateau Risk
Mobile ordering, delivery partnerships, and loyalty programs have become table stakes, not competitive advantages. The question is no longer whether digital sales matter, it’s whether digital sales growth can sustain overall traffic growth as the channel matures.
Mobile Ordering, Loyalty Programs, and Customer Traffic
Digital channels (mobile app, web, third-party delivery) now represent 25-40% of sales at mature QSR operators. This shift has tangible benefits: higher check average, improved customer data, faster throughput in drive-thru lines, and direct customer relationships that reduce reliance on third-party delivery platforms.
However, the growth rate of digital sales is moderating as penetration plateaus. When digital sales were 5-10% of total, growing digital 50% year-over-year was easy and masked flat or declining traffic. Now that digital is 30%+ of sales, digital growth rates of 15-20% no longer offset declining in-store traffic.
The critical metric: total comparable store sales, not digital sales growth in isolation. If digital growth is offset by in-store traffic declines, the operator is cannibalizing existing customers rather than growing the overall customer base.
Loyalty programs are similarly maturing. Early adopters gained significant traffic and data advantages. Now loyalty is expected. Operators without strong loyalty programs lag, but strong loyalty programs no longer drive outsized growth, they prevent traffic loss. Tools like the Wendy’s News & Restaurant Tracker help investors monitor real-time traffic patterns and loyalty program effectiveness across the QSR landscape.
Franchise Model Resilience in Economic Uncertainty
The franchise model is the structural backbone of modern QSR operators. Understanding franchise economics is essential for evaluating fast food stocks to watch.
Franchisee Economics and Unit-Level Profitability
Franchisees operate individual restaurants and pay the franchisor a combination of royalties (typically 5-6% of sales) and rent (typically 5-8% of sales). Franchisees also pay for labor, food, utilities, and local marketing. Unit-level profitability, the cash a franchisee keeps after all expenses, is the true health indicator of the franchise system.
When unit-level profitability declines, franchisees close underperforming locations, delay remodels, and reduce capital investment in their stores. This cascades into lower sales, reduced royalty payments to the franchisor, and system-wide deterioration.
Rising labor costs and commodity inflation have compressed franchisee margins significantly. Many franchisees operate on 3-6% unit-level profit margins, razor-thin. A 10% increase in labor costs can eliminate profitability entirely.
Healthy franchise systems show:
- Stable or growing unit volumes (sales per location)
- Stable or declining unit closures
- Franchisee investment in remodels and technology
- Franchisee expansion into new markets
Deteriorating franchise systems show:
- Declining unit volumes despite menu price increases
- Rising unit closure rates
- Franchisee reluctance to invest in remodels
- Franchisee financial distress or bankruptcy filings
The franchisor benefits from a healthy franchisee base. When franchisees struggle, royalty growth stalls and the entire system weakens.
Fast Food Stocks to Watch: Turnaround Plans and C-Suite Strategy
Identifying credible turnaround plans separates speculative value plays from genuine opportunities. A turnaround plan must address three core elements: traffic stabilization, margin improvement, and cash flow generation.
Supply Chain Cost Breakdown and Operational Efficiency
Supply chain costs represent 28-35% of QSR system sales. This includes food, packaging, and logistics. Commodity inflation has been a persistent headwind, but operators with efficient supply chains and scale advantages have absorbed cost increases better than smaller competitors.
Turnaround plans that focus solely on menu price increases without addressing supply chain efficiency are incomplete. Credible turnarounds include:
- Renegotiation of supplier contracts: using scale to reduce per-unit food costs.
- Menu engineering: Shifting sales mix toward higher-margin items or items with more stable commodity costs.
- Operational simplification: Reducing menu complexity to improve kitchen efficiency and reduce waste.
- Direct sourcing: Bypassing distributors for high-volume commodities to reduce costs.
Operators that have successfully managed supply chain costs through the 2022-2026 inflationary period demonstrate management competence. Those that have simply raised menu prices without supply chain improvements signal weak operational execution.
Technology Investment and Digital Transformation ROI
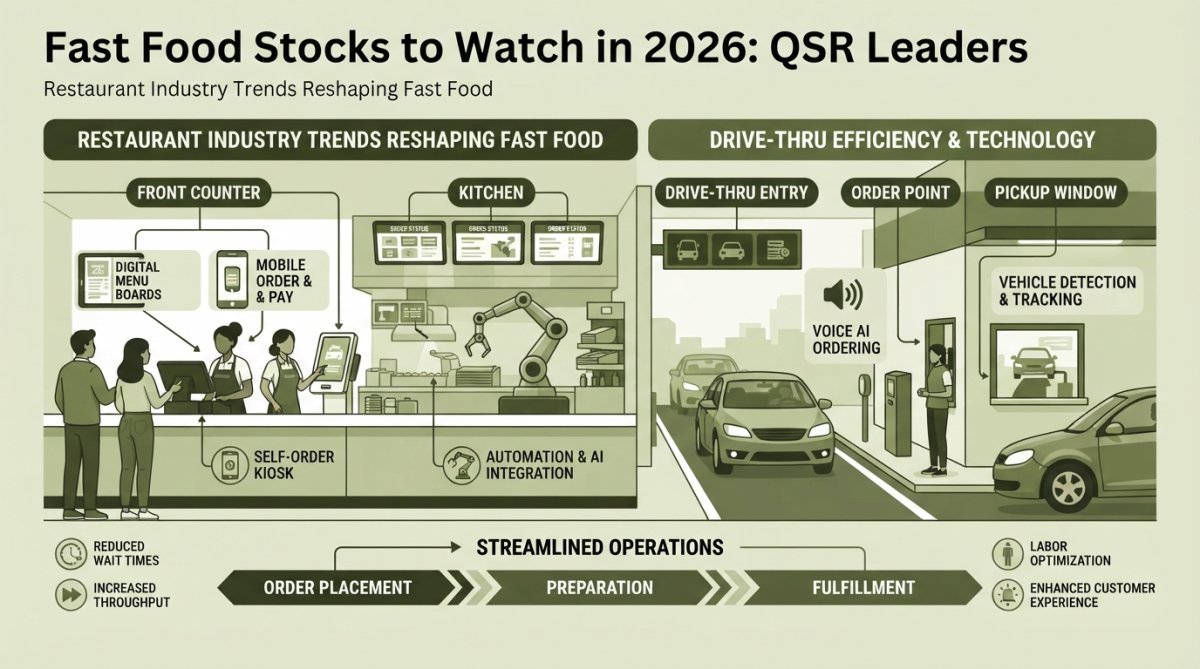
AI-driven drive-thru technology, kitchen display systems, and predictive analytics are reshaping QSR operations. The operators investing in these technologies are seeing measurable improvements in throughput, order accuracy, labor efficiency, and customer satisfaction.
However, technology investment requires capital and operational discipline. A turnaround plan that includes technology investment must show:
- Concrete ROI metrics: Labor hours saved per location, throughput improvements (orders per hour), or customer satisfaction gains.
- Rollout timeline: Is the technology being piloted, scaled, or fully deployed? Pilots show promise but don’t yet move the needle.
- Integration with existing systems: Technology that doesn’t integrate with POS systems, loyalty programs, and supply chain management creates friction rather than efficiency.
Technology for its own sake, investing in AI or automation without clear operational benefit, is a red flag. Credible turnarounds show specific, measurable improvements tied to technology investment. Resources like the Wendy’s Stock & Investor Insights platform provide detailed operational metrics and technology rollout tracking for investors evaluating management execution.
Dividend Sustainability vs. Value Trap: What Investors Must Know
A high dividend yield is attractive, but it’s a trap if the dividend is unsustainable. The QSR sector has historically returned cash to shareholders through dividends and buybacks, but 2026 presents a critical test of dividend safety.
Evaluate dividend sustainability by asking:
-
Is free cash flow growing or declining? If free cash flow is flat or declining while the dividend is maintained, the company is funding dividends through debt increases or asset sales. This is unsustainable.
-
Is the payout ratio above 80% of free cash flow? If yes, the dividend leaves little room for debt reduction, reinvestment, or economic downturns. A recession would force a dividend cut.
-
Is the dividend supported by recurring operations or one-time gains? Asset sales, real estate monetization, or equity raises are one-time events. Dividends must come from ongoing operations.
-
What’s the debt-to-EBITDA ratio? QSR operators typically carry 2-4x debt relative to EBITDA. Above 4x signals use risk. If use is rising while dividends are maintained, the company is prioritizing shareholder returns over balance sheet health.
-
Are franchisees healthy? If franchisee traffic and profitability are declining, royalty growth will slow. Dividends cannot grow if the underlying cash generation engine is weakening.
Many fast food stocks to watch offer attractive yields precisely because the market doubts dividend sustainability. A 6-7% yield on a QSR stock signals market skepticism about future cash generation. Before buying for yield, understand why the market is pricing in dividend risk.
Market Sentiment and Retail Investor Interest
Retail investor sentiment toward QSR stocks has shifted materially in 2026. Stocks that were considered defensive income plays are now viewed as value traps or turnaround stories. This shift in sentiment creates both opportunity and risk.
Opportunity exists for investors with conviction in specific turnaround narratives. If a company’s new CEO has a credible operational improvement plan, digital transformation is gaining traction, and franchisee economics are stabilizing, the stock may be undervalued relative to recovery potential.
Risk exists for investors chasing yield without understanding the operational narrative. A high dividend yield is not a margin of safety if the dividend is unsustainable. Investors must distinguish between temporary headwinds (macro slowdown, temporary traffic declines) and structural decline (market share loss, franchisee deterioration, competitive obsolescence).
The Buy Wendy’s team tracks market sentiment, analyst ratings, and short interest as sentiment indicators. Rising short interest can signal genuine operational concerns or investor overreaction. Analyst downgrades may reflect consensus pessimism that creates opportunity for contrarian investors with deeper operational analysis.
Key Takeaways
- Fast food stocks to watch in 2026 require operational analysis, not yield chasing. High dividend yields signal market skepticism about cash generation. Understand why before buying.
- Franchisee economics are the foundation. When unit-level profitability declines, the entire system weakens. Menu price increases only help if franchisees can sustain them without traffic loss.
- Digital sales growth is maturing. Total comparable store sales, including in-store traffic, is the true health metric. Digital growth that masks in-store traffic declines is cannialization, not growth.
- Turnaround plans must address supply chain efficiency, not just pricing. Operators that raise menu prices without improving operational efficiency are masking underlying weakness.
- Dividend sustainability requires growing free cash flow. If dividends are maintained while free cash flow declines, the dividend is at risk. Payout ratios above 80% leave no margin for error.
- Macro sensitivity is a feature, not a bug. Fast food traffic is highly correlated with consumer confidence and employment. A recession would pressure traffic and test dividend safety.
Frequently Asked Questions
Which publicly traded fast food companies should I monitor as fast food stocks to watch?
The QSR sector includes major publicly traded operators spanning traditional fast food, fast casual, and emerging segments. Key metrics include dividend yield, cash flow generation, same-store sales trends, and franchise system health. Investors should evaluate each company's turnaround plan, menu price strategy, and digital transformation progress. Research official earnings reports and SEC filings to assess competitive positioning within the fast food landscape.
How do restaurant industry trends affect fast food stock valuations?
Consumer spending cycles, inflation pressures, and labor costs directly impact QSR margins and profitability. Fast casual competition has fragmented the market, forcing traditional fast food operators to innovate on menu pricing, digital ordering, and customer experience. Supply chain disruptions and commodity cost volatility create earnings volatility. Understanding these trends helps investors identify which fast food stocks to watch for sustainable growth versus those facing structural headwinds.
Is digital sales growth in fast food sustainable, or has the market plateaued?
Digital sales in fast food remain a critical growth lever, but maturation varies by operator. Mobile ordering penetration, loyalty program engagement, and delivery economics differ significantly. Some chains have achieved 30%+ digital mix; others lag. The key question for investors: Can digital sales growth offset margin compression from delivery fees and promotional activity? Evaluate each company's digital strategy as part of your fast food stocks to watch analysis.
Are fast food dividend stocks safe, or do they represent value traps?
Dividend sustainability depends on free cash flow, debt levels, and capital allocation discipline. Some fast food operators maintain attractive yields backed by stable franchise royalties; others face pressure from declining customer traffic or aggressive share buybacks. Investors must distinguish between value stocks (temporarily depressed, fundamentally sound) and value traps (permanently impaired). Review cash flow statements, debt-to-EBITDA ratios, and management's turnaround plans before committing to fast food stocks.
This article was written using GrandRanker