
Wendy’s holds an estimated 11.4% share of the U.S. burger market, ranking a distant third behind McDonald’s near 48% and roughly a point ahead of Burger King’s 10%, according to Barclays’ 2024 category estimate. That figure sat before a rough stretch: Wendy’s U.S. systemwide sales declined through the first half of 2026, and the chain’s domestic footprint contracted by a notable number of locations over the same period.
That combination, a stable-but-modest share estimate paired with a sharp recent sales contraction, is the tension every analyst modeling WEN stock needs to resolve. A market-share percentage is a lagging signal. Systemwide sales and unit counts move faster, and in 2026 they moved the wrong direction.
Wendy’s Market Share Snapshot:
- U.S. burger category share: approximately 11.4% (Barclays, 2024 estimate)
- Category rank: third, behind McDonald’s and Burger King
- H1 2026 U.S. systemwide sales: down 7.7% year-to-date
- Net U.S. unit change through Q2 2026: negative 245 locations
- 2025 U.S. systemwide sales (QSR Magazine): $11,898 million
Key Takeaways
Burger market as the third-largest chain, but 2026 sales and unit declines suggest that share is under active pressure rather than static.
| Point | Details |
|---|---|
| Headline market share | Wendy’s holds an estimated 11.4% U.S. burger share, per Barclays’ 2024 category estimate, ranking third behind McDonald’s and Burger King. |
| Sales trend is negative | U.S. systemwide sales fell 7.7% year-to-date through H1 2026, the sharpest deterioration in this data series. |
| Unit count is shrinking | Wendy’s closed a net 245 U.S. locations through Q2 2026, dropping from 5,967 to 5,724 units. |
| Royalty sensitivity is high | Because Wendy’s system is predominantly franchised, systemwide sales declines flow through to royalty revenue with limited cushioning. |
| Watch same-store sales and unit closures next | Two consecutive quarters of positive same-store sales growth would be the clearest signal of a genuine turnaround. |
| Buywendys tracks this quarterly | Buywendys’s research products convert each earnings release into usable market-share and valuation scenario data for investors. |
Table of Contents
- Wendy’s Market Share and Current Sales Snapshot
- How Wendy’s Market Share Has Shifted Since 2020
- Wendy’s Competitive Standing Against McDonald’s and Burger King
- What Is Driving Wendy’s Market Share, and What Could Move It Next
- Investor Metrics That Connect Market Share to Wendy’s Financial Results
- Q2 2026 Earnings Recap and What It Means for Market Share
- How Wendy’s Market-Share Estimates Are Compiled
- BuyWendy’s Take: Three Scenarios for Wendy’s Market Share and Valuation
- A Measured Read on Wendy’s Turnaround Timeline
- Track Wendy’s Market Share With BuyWendy’s Research Tools
- Primary Sources for Wendy’s Market Share Research
- Sources
Wendy’s Market Share and Current Sales Snapshot
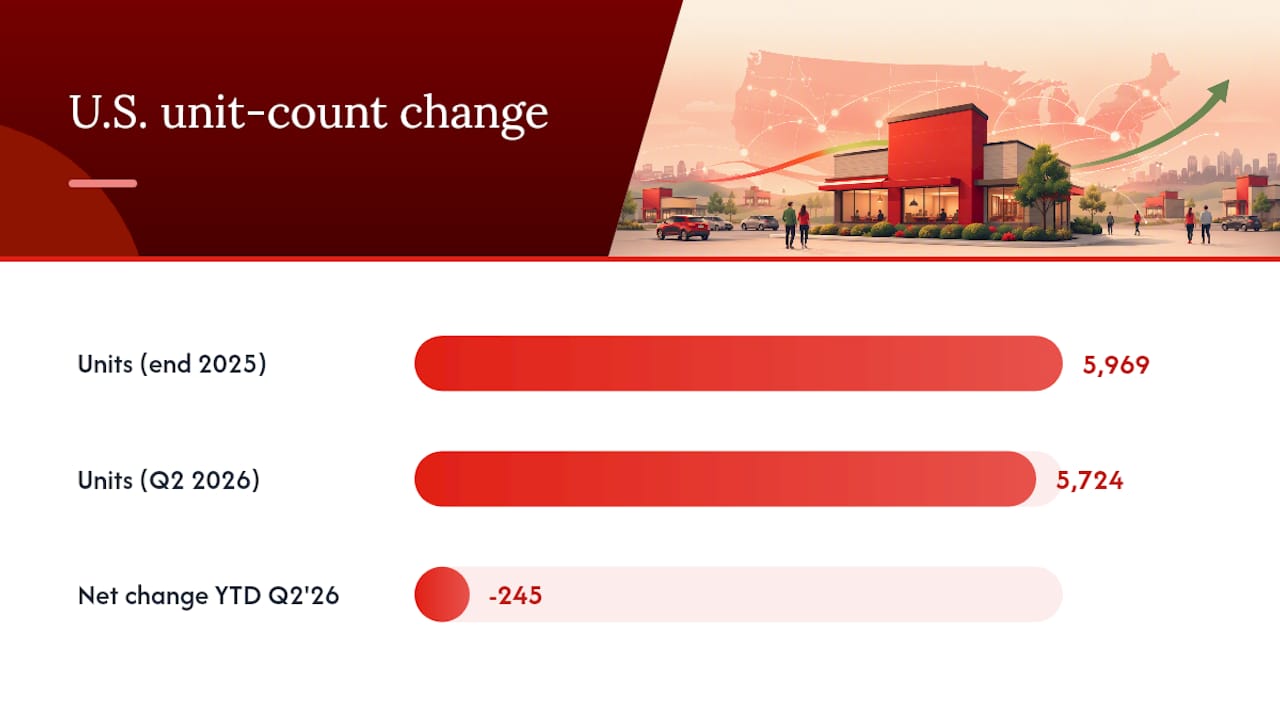
The headline numbers for 2026 tell a story of a company defending share rather than gaining it. Wendy’s ranked second among U.S. burger chains by systemwide sales in 2025, with $11,898 million in U.S. systemwide sales and 5,969 total units at that reporting point, according to QSR Magazine’s 2026 industry ranking. By the close of Q2 2026, unit count had slipped to 5,724, a net reduction of 245 restaurants in roughly six months.
| Metric | Figure | Source |
|---|---|---|
| U.S. burger market share (2024 est.) | ~11.4% | Barclays via FastCompany |
| U.S. systemwide sales, YTD H1 2026 | Down 7.7% | Company earnings data |
| Global systemwide sales, Q2 2026 | $3,422.5 million | Company Q2 2026 release |
| U.S. unit count, quarter-end Q2 2026 | 5,724 | Company Q2 2026 release |
| Net U.S. unit change, YTD through Q2 2026 | −245 locations | Company Q2 2026 release |
A few datapoints stand out for anyone building a model off these figures:
- The systemwide sales decline is a company-wide U.S. figure, suggesting the softness is structural rather than an isolated regional or seasonal occurrence.
- Global systemwide sales of $3,422.5 million for Q2 2026 alone, reported directly in the company’s Q2 2026 results, gives analysts a clean baseline for annualizing full-year systemwide sales under different traffic-recovery assumptions.
- Unit contraction of 245 locations in roughly two quarters is a faster closure pace than Wendy’s posted in recent prior years, and it directly shrinks the sales base from which market share is calculated.
Where third-party estimates like Barclays’ 11.4% figure diverge from company-reported systemwide sales is largely a function of timing and definitional scope: Barclays’ number reflects a 2024 snapshot of the domestic burger category, while the company’s Q2 2026 release reflects a live, evolving sales base. Treat the market-share percentage as a slower-moving anchor and the systemwide sales trend as the leading indicator.
How Wendy’s Market Share Has Shifted Since 2020
Wendy’s share position has been remarkably stable at the headline level, hovering in the low double digits for years, even as the underlying sales trend has weakened noticeably since 2024. That stability in the percentage, paired with real deterioration in unit economics, is exactly the kind of gap that a snapshot statistic can hide.
The 2020 through 2024 stretch was Wendy’s growth-investment phase. The company leaned into breakfast expansion, digital ordering, and a broader push into value-menu positioning to defend traffic against McDonald’s and Burger King. Barclays’ 2024 benchmark, placing Wendy’s at roughly 11.4% of the category, effectively marks the high-water point of that investment cycle, a share level built on years of daypart expansion rather than one strong quarter.
2025 brought a shift in framing. QSR Magazine’s ranking data shows Wendy’s still holding the number two spot by systemwide sales at $11,898 million, but growth had already begun to flatten relative to the broader category.
- 2020 to 2023: Investment phase, breakfast rollout, and international expansion groundwork.
- 2024: Barclays benchmark of approximately 11.4% U.S. burger share, a period of relative stability.
- 2025: $11,898 million in U.S. systemwide sales, second-ranked by sales among burger chains per QSR Magazine.
- H1 2026: Systemwide sales down 7.7% year-to-date, unit count falling from 5,967 to 5,724.
Analysts covering the CEO’s public comments have pointed to quality perception issues as a specific driver behind the 2025 to 2026 slide, a factor distinct from the pricing and value-menu dynamics that shaped the earlier growth years. That distinction matters for modeling: a quality-perception problem tends to resolve on a different timeline than a pure pricing response.
Wendy’s Competitive Standing Against McDonald’s and Burger King
Ranking burger chains on a single dimension, market share alone, understates how much separation actually exists between the top three players. Analysts should weigh market share alongside systemwide sales, same-store growth, unit count, average unit volume (AUV), franchise mix, and margin indicators before drawing conclusions about competitive position.
- Market leader: McDonald’s. Barclays estimates McDonald’s commands roughly 48% of the U.S. burger category, more than four times Wendy’s share and a scale advantage that shows up in nearly every operating metric, from marketing budget to supply chain leverage.
- No. 2 position: contested between Wendy’s and Burger King on a quarterly basis. Wendy’s led on 2025 full-year systemwide sales at $11,898 million, but Burger King reclaimed the number two spot on a quarterly sales basis in mid-2026, reflecting how quickly short-term sales momentum can reshuffle rankings even when annual figures still favor Wendy’s.
- No. 3 position: Burger King on the 2024 Barclays share basis, at approximately 10%. The one-to-two point gap between Wendy’s 11.4% and Burger King’s 10% is narrow enough that a single strong or weak quarter can flip the ordering, which is precisely what happened in mid-2026.
Third-party ranking tables consistently show Wendy’s trailing the category leader by a wide margin, yet often posting a higher average unit volume than some peers, which makes unit-count movement unusually consequential to total sales trajectory. A chain losing units while holding AUV steady still loses systemwide sales and, eventually, share.
The IBISWorld industry data describing the burger-restaurant category as highly fragmented is a useful reminder that Wendy’s 11.4% is a genuinely meaningful share in a market with hundreds of smaller competitors.
What Is Driving Wendy’s Market Share, and What Could Move It Next
Several structural forces have shaped Wendy’s share trajectory over the past two years, and distinguishing which ones are reversible versus structural is the core work of building a forward model.
- Traffic decline outpacing check growth. Operational data from Q2 2026 shows average checks rose while overall traffic fell enough to shrink total sales, a pattern that points to a value-perception gap rather than a pricing problem alone.
- Franchise economics under pressure. With the bulk of Wendy’s system franchised, declining unit-level profitability at the franchisee level can slow reinvestment and new-store development, compounding the unit-count decline already visible in 2026.
- Value-platform complexity. Promotional offers that are hard for customers to parse can suppress traffic even when the underlying price points are competitive, a dynamic distinct from simply being “too expensive.”
- International expansion as a hedge. Wendy’s has been targeting Latin America for new unit growth, a deliberate strategy to offset U.S. market saturation and domestic traffic softness with incremental systemwide sales from new geographies.
- Breakfast and daypart execution. Adjustments to breakfast hours and discounting strategy directly affected the Q2 2026 traffic-versus-check dynamic, illustrating how a single daypart decision can move quarterly numbers materially.
Pro Tip: Don’t watch same-store sales growth in isolation. Cross-reference it against net unit change each quarter. A chain can report flat or modestly negative same-store sales while still losing meaningful systemwide sales and share if unit closures are accelerating, exactly the pattern Wendy’s showed through Q2 2026.
The highest-probability risks to a near-term share recovery are continued franchisee-level margin compression, a slower-than-expected international ramp, and a value-platform message that still isn’t resonating enough to reverse traffic softness. Each of these would show up first in same-store sales and unit-development guidance well before it appears in a headline market-share update.
Watch how Wendy’s stock reacts to each of these signals individually rather than waiting for a single consolidated share estimate, since third-party share benchmarks like Barclays’ update infrequently while company-reported metrics update every quarter.
Investor Metrics That Connect Market Share to Wendy’s Financial Results
Market share is a useful headline number, but it’s the connective tissue between share and financial outcomes that actually matters for a valuation model. Because Wendy’s operates a predominantly franchised system, revenue for the parent company comes primarily from royalties and rents rather than store-level margins, which means systemwide sales changes flow through to reported revenue with unusual directness.
The core metrics to track, in order of how directly they map to reported financials:
- Systemwide sales. The total sales generated across company-operated and franchised restaurants combined; royalty revenue is typically a fixed percentage of this figure.
- Same-restaurant sales growth. Isolates performance at existing locations, stripping out the effect of new openings or closures.
- Average unit volume (AUV). Systemwide sales divided by unit count; a rising AUV with a falling unit count can still produce declining systemwide sales.
- Franchise mix. The share of units that are franchised versus company-operated; a higher franchise mix generally means steadier royalty income but less direct margin capture.
- EBITDA margin and free cash flow. The profitability lens that shows whether royalty income is translating into distributable cash for dividends and buybacks.
Because royalty revenue tracks systemwide sales so closely in a franchise-centric model, a sales decline offers the company little margin cushioning at the parent level. A simplified way to estimate the royalty impact of a market-share change: multiply the estimated systemwide sales tied to that share point by the disclosed royalty rate, then compare the result against the prior quarter’s royalty revenue line to see the percentage swing.
A basic quarterly tracking table analysts can populate each period:
Populate this table directly from each quarterly earnings breakdown to build a running series rather than relying on a single quarter’s snapshot.
Q2 2026 Earnings Recap and What It Means for Market Share
The second quarter of 2026 gave analysts the clearest read yet on how quickly Wendy’s competitive position can shift. The company reported global systemwide sales of $3,422.5 million for the quarter, alongside the previously noted U.S. unit count decline to 5,724 locations.
| Metric | Q1 2026 | Q2 2026 |
|---|---|---|
| U.S. systemwide sales trend | Down, contributing to YTD decline | Down 7.7% YTD (cumulative) |
| Global systemwide sales | Not separately highlighted | $3,422.5 million |
| U.S. unit count | Declining from 5,967 baseline | 5,724 (quarter-end) |
| Net U.S. unit change | Partial-year contraction | −245 cumulative through Q2 |
On the earnings call, management directly addressed the traffic and quality issues behind the numbers. Commentary from the Q2 FY2026 earnings call transcript acknowledged ongoing traffic pressure and framed the quarter as part of a broader operational reset rather than an isolated miss.
Management signaled that traffic trends observed in July 2026 closely matched the patterns seen throughout Q2, an indication that the softness extended into the following quarter rather than reversing immediately after the reporting period closed.
That detail matters more than the headline sales figure itself. If July had shown a sharp rebound, analysts could reasonably treat Q2 as a trough. Instead, the continuation of the pattern implies:
- Near-term royalty revenue is likely to remain pressured into Q3 2026, given the direct link between systemwide sales and royalty income.
- Unit-count stabilization, not just same-store sales improvement, should be treated as a precondition for any market-share recovery narrative.
- The company’s own management commentary, not just third-party estimates, now supports a “reset” framing rather than a “temporary dip” framing for the turnaround timeline.
How Wendy’s Market-Share Estimates Are Compiled
Every market-share figure cited for Wendy’s traces back to one of three source types, and knowing which type underlies a given number changes how much confidence to place in it.
- Company-reported systemwide sales and unit counts, disclosed quarterly in 10-Q filings and earnings releases, are the most precise and timely figures available, though they describe Wendy’s in isolation rather than its share of the broader category.
- Third-party category estimates, primarily from Barclays, assign a specific percentage share by comparing Wendy’s sales against the total estimated size of the U.S. burger market. These estimates update infrequently, often annually, which is why the 11.4% figure still traces to 2024 even as company-level sales have shifted materially since.
- Industry ranking aggregators, including Statista’s Wendy’s topic page and QSR Magazine’s annual QSR 50 ranking, compile multi-year sales series that are useful for trend reconstruction and cross-checking company disclosures against independent tallies.
A methodology caveat worth flagging directly: different agencies define “the burger market” differently, some include limited-service chicken sandwich chains that compete for the same traffic, others do not, and timing mismatches between a 2024 share estimate and 2026 company results can shift the effective picture by a point or two in either direction. Treat any single market-share percentage as a directional anchor rather than a precise, real-time figure.
BuyWendy’s Take: Three Scenarios for Wendy’s Market Share and Valuation
Based on the data reviewed above, Buywendys sees three plausible paths for how Wendy’s market-share and sales trajectory could evolve over the next several quarters, each with distinct implications for how analysts should treat WEN in a valuation model.
- Base case: Traffic pressure persists through Q3 2026 before stabilizing, systemwide sales decline moderates toward flat by year-end, and market share holds roughly steady near the 11% range as unit closures slow. Valuation implication: modest downward pressure on near-term price targets, offset by dividend support and stable franchise royalty economics.
- Downside case: Unit closures accelerate beyond the 245 already reported, international expansion in Latin America ramps more slowly than planned, and same-store sales remain negative into 2027. Valuation implication: royalty revenue compression deepens, pressuring free cash flow and potentially the dividend coverage ratio analysts watch closely.
- Upside case: Value-platform simplification and quality-perception improvements drive a traffic inflection by Q4 2026, unit development stabilizes, and Wendy’s begins closing the gap with Burger King on a quarterly sales basis. Valuation implication: multiple expansion becomes plausible if same-store sales turn positive for two consecutive quarters.
Proprietary scenario work, cross-referencing company disclosures against Barclays’ category benchmark and Statista’s historical series, suggests the market is currently pricing Wendy’s closer to the downside case than the base case, which is where a genuine valuation gap could emerge for patient investors.
For portfolio managers, a practical threshold: revisit position sizing if same-store sales growth turns positive for two straight quarters, or if unit closures exceed 300 for the full year, whichever signal arrives first. Buywendys’s forecast and analysis work through 2028 walks through these scenario mechanics in more detail for readers building their own models.
A Measured Read on Wendy’s Turnaround Timeline
The data supports cautious patience rather than either dismissal or conviction.
A genuine turnaround, if the current strategy works, likely takes three to four quarters to show up clearly in same-store sales and unit-development numbers, not one strong print. The most useful signals to track over the next two quarters are:
- Whether same-store sales growth turns positive, even marginally, for two consecutive quarters.
- Whether the pace of U.S. unit closures slows meaningfully from the 245 already logged through Q2 2026.
- Whether Latin American unit openings begin contributing a visible offset to domestic softness.
- Whether management’s next earnings call frames July’s continued weakness as an anomaly or acknowledges further deterioration.
- Whether franchise-level profitability commentary improves, since franchisee health ultimately determines the pace of new development.
Typical modeling assumptions worth stress-testing: a traffic recovery beginning in Q4 2026 rather than Q3, unit development remaining roughly flat rather than resuming net growth until 2027, and royalty sensitivity assumptions built directly off the systemwide sales trend rather than a static historical average.
Track Wendy’s Market Share With BuyWendy’s Research Tools
Reading a quarterly earnings release is one thing. Turning it into a usable valuation model, with market-share sensitivity, royalty projections, and scenario ranges, is a different job entirely, and it’s the one Buywendys built its research products to solve.
Buywendys publishes regular, data-driven updates on Wendy’s systemwide sales, unit trends, and competitive positioning, translating each quarterly print into the metrics that actually move a valuation model rather than leaving readers to reconcile Barclays estimates against company filings on their own. If you want to go deeper than the scenario ranges outlined above, the Wendy’s stock fundamental analysis report includes a full model template built for testing your own market-share and royalty assumptions quarter by quarter. Readers weighing whether the current price already reflects the downside case should start with the valuation analysis on whether Wendy’s stock is undervalued to see how the numbers stack up against a base-case recovery timeline.
Primary Sources for Wendy’s Market Share Research
- The company’s Q2 2026 earnings release was used for systemwide sales, unit counts, and management commentary on traffic and quality.
- Statista’s Wendy’s topic page supplied historical multi-year sales context for trend reconstruction.
- The Barclays-based market-share estimate reported by FastCompany anchored the headline 11.4% share figure and the McDonald’s and Burger King comparison points.
- QSR Magazine’s 2026 ranking provided 2025 systemwide sales and unit-count figures used for the multi-year comparison table.
- The Q2 FY2026 earnings call transcript was the source for direct management quotes on traffic and turnaround timing.
Different agencies define the burger category and reporting periods differently, so treat any single market-share percentage as directionally accurate rather than exact to a decimal point, and always cross-check a third-party estimate against the company’s most recent quarterly disclosure before building it into a model.
This article is general information, not a substitute for advice from a qualified financial advisor. Consult a qualified financial professional about your own circumstances before acting on anything here.
Sources
- Wendy’s – FastCompany coverage on burger ranking
- THE WENDY’S COMPANY REPORTS SECOND QUARTER 2026 RESULTS — PR Newswire (company release)
- Wendy’s – statistics & facts — Statista topic page
- QSR 50 — 2026 top burger chains ranked by sales