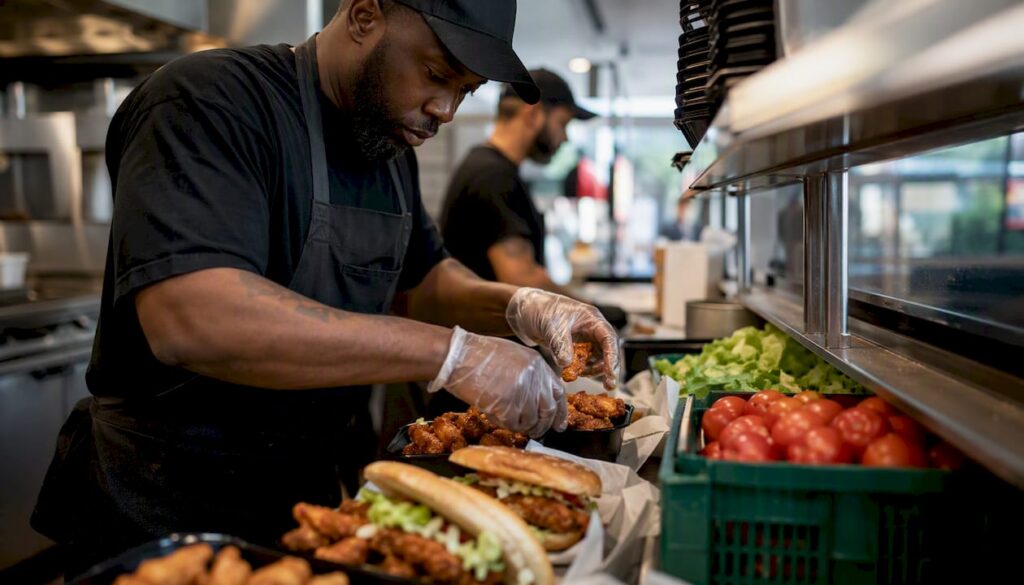
Limited-service menu prices rose 0.1% in June 2026 and sit 3.4% above June 2025 levels, according to the National Restaurant Association’s menu-price tracker. That year-over-year figure still outpaces overall CPI, which means quick-service operators are absorbing costs faster than the broader economy is cooling. For consumers, the math is simple: eating out remains meaningfully more expensive than it was two years ago, even as monthly price increases have slowed to a fraction of their 2023 peak. For operators and investors, the real question is whether this moderation holds or whether commodity and labor pressures push the needle back up.
Key data sources tracking this trend include:
- National Restaurant Association menu-price tracker (monthly CPI breakdown by service type)
- U.S. Bureau of Labor Statistics food-away-from-home CPI series (monthly release)
- Toast median menu-item price dataset (reported through trade press and the Food Institute)
- USDA Food Price Outlook (commodity and food-category forecasts)
- Nation’s Restaurant News (NRN) operator and analyst coverage
Key Takeaways
Quick-service menu inflation has moderated sharply from its 2023 peak but remains above grocery inflation, making traffic recovery the central operational challenge for 2026.
| Point | Details |
|---|---|
| Current inflation rate | Limited-service menu prices rose 0.1% in June 2026 and 3.4% year-over-year, per the National Restaurant Association. |
| Peak vs. now | Annual menu inflation peaked at 8.8% in March 2023; the 2026 monthly average of ~0.2% reflects significant deceleration. |
| Hardest-hit items | Beef, specialty coffee, and wings lead category increases; Toast data shows median burgers up 2.2% and coffee up 7.1%. |
| Top operator levers | Phased market-level price testing, value bundle engineering, and menu simplification protect margin without sacrificing traffic. |
| Investor signal | In franchised systems, same-store sales split between check size and traffic is the clearest indicator of pricing sustainability; Buywendys tracks these metrics with sourced franchise-economics analysis. |
Table of Contents
- Quick service menu inflation: the current data snapshot
- What is actually driving menu prices higher
- Which menu items have been hit hardest
- How quick service differs from full service in an inflationary environment
- How operators are managing menu inflation right now
- What the near-term outlook looks like for menu inflation
- How menu inflation connects to franchise economics and investor signals
- The levers that matter most this quarter
- Sources
Quick service menu inflation: the current data snapshot
The headline numbers tell a story of deceleration, not resolution. Menu inflation peaked at 8.8% annually in March 2023, and through the first half of 2026 the monthly rate has averaged roughly 0.2%. That is a dramatic pullback, but the cumulative price level remains elevated. Operators who raised prices aggressively in 2022 and 2023 are now managing a customer base that remembers what a burger cost three years ago.
A few trends stand out from this data:
- Full-service restaurants raised prices faster month-over-month in June (+0.4%) than limited-service (+0.1%), suggesting quick-service chains are exercising more pricing restraint right now.
- The gap between restaurant inflation (3.4%) and grocery inflation (2.7%) is narrowing in 2026, which could gradually reduce the cost advantage of cooking at home and support restaurant traffic.
- Annual menu inflation at 3.4% still exceeds the Federal Reserve’s 2% general inflation target, keeping pressure on consumer budgets.
The March 2023 peak of 8.8% annual menu inflation now looks like the ceiling. Monthly growth since then has moderated steadily, though not uniformly. Any commodity shock or renewed wage pressure could interrupt that trajectory.
What is actually driving menu prices higher
Labor is the single largest cost driver in quick service, and it has not eased. State-level minimum wage increases, tightening labor markets in urban corridors, and the operational cost of turnover have all kept wage pressure elevated. Fast-food prices rose nearly 28% from 2019 to 2023 in the limited-service meals and snacks category, compared with roughly 19% for overall CPI in the same period. Labor costs were a primary contributor to that gap.
Beyond wages, the main cost pressures include:
- Commodity costs: Beef and veal prices are projected to rise approximately 7.5% in 2026, according to USDA forecasts summarized by the Food Institute. Eggs and dairy have shown volatility tied to supply disruptions, though some of that pressure has eased.
- Fuel and logistics: Transportation costs affect both raw ingredient delivery and finished-product distribution. Supply chain normalization has helped, but fuel price swings remain a wildcard.
- Packaging: Input costs for paper, plastic, and compostable materials have stayed above pre-pandemic levels. Logistics and packaging cost pressures are also tracked by supply chain standards bodies, including Conexxus, which monitors checkout and fulfillment cost dynamics across convenience and foodservice channels.
- Franchise-specific costs: Royalties and rent obligations are typically calculated as a percentage of sales. When operators raise menu prices to cover input costs, a portion of that revenue flows directly to the franchisor, which compresses the net benefit to the franchisee.
One important nuance: some commodity costs have normalized. Poultry and certain dairy inputs have come off their 2022 highs. The persistent pressure is labor, and that is structural rather than cyclical. Operators who built their 2023 pricing strategy around commodity spikes may find that labor is the cost they cannot price their way out of.
Which menu items have been hit hardest
Not all categories inflated equally. Beef-forward items, specialty coffee, and protein-heavy options have seen the steepest increases, driven by a combination of commodity exposure and consumer willingness to pay.
Toast-reported median price data, as covered by the Food Institute, shows:
- Cold brew coffee: up 3.7% to a median of $5.62
- Median restaurant coffee: up 7.1% to $3.75
- Median burger: up 2.2% to $14.71
That $14.71 median burger price is a full-service figure, but it illustrates the directional pressure on beef-based items across the industry. In quick service, where burgers are often the anchor item, even a 2% price increase on a $6–$8 item can shift consumer behavior at the margin.
Wings, burritos, and premium sandwiches have also absorbed above-average increases, largely because their protein inputs (chicken wings, beef, pork) remain volatile. Coffee is a separate story: the specialty coffee segment has used premiumization to justify higher prices, but there is a ceiling. A consumer who pays $5.62 for cold brew at a quick-service counter is one price increase away from making it at home.
The substitution effect is real and measurable. Operators and chefs are actively rethinking portions and value platforms in response to multi-year cost increases, recognizing that customers who feel priced out of their usual order will either trade down within the menu or reduce visit frequency entirely. For a deeper look at how product-level margin analysis works across specific items, the economics of fast food fries offers a useful framework for thinking about value engineering at the item level.
How quick service differs from full service in an inflationary environment
Quick-service and full-service restaurants face the same input costs but respond to inflation through fundamentally different mechanisms. Understanding that distinction matters for both operators and investors.
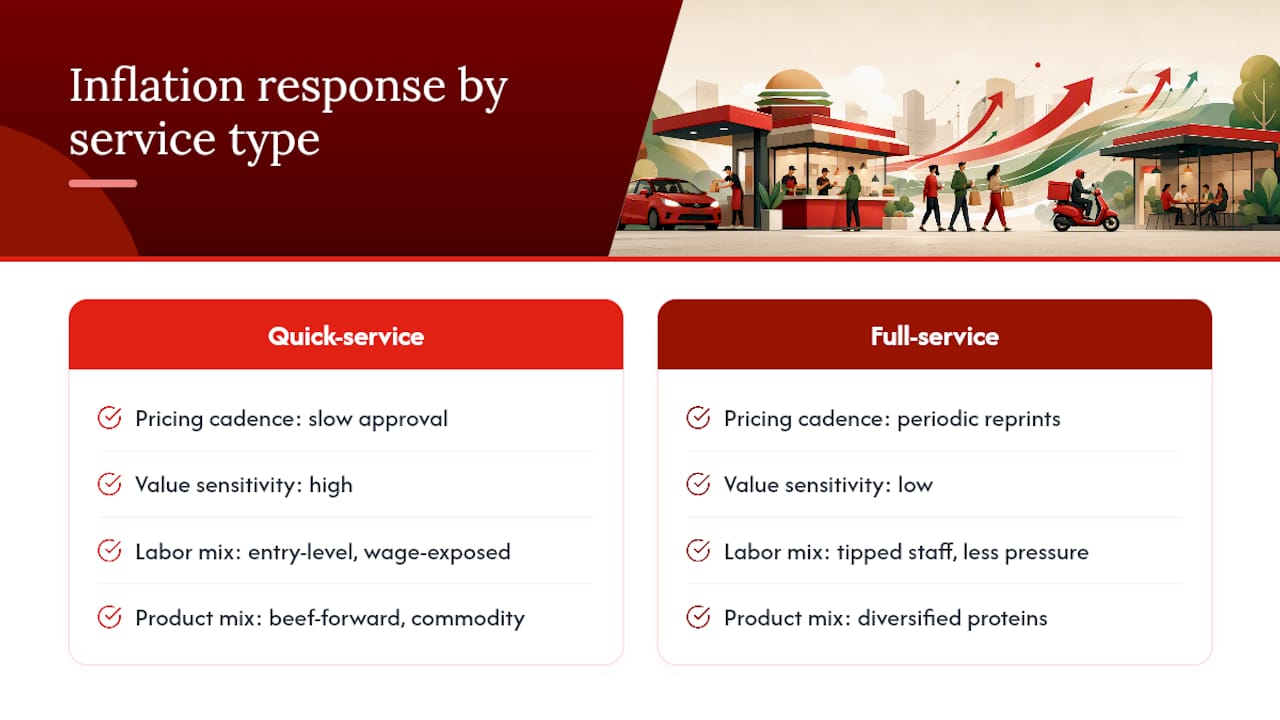
Pricing cadence: Full-service restaurants can adjust prices through periodic menu reprints with relatively low friction. Quick-service chains, especially franchised ones, often require system-wide approval for price changes, which slows response time but also prevents the kind of aggressive, uncoordinated pricing that erodes brand trust.
Value-menu sensitivity: Quick service built its customer base on price accessibility. A consumer who visits a limited-service chain three times a week is acutely aware of price changes in a way that an occasional full-service diner is not. This makes quick-service operators more exposed to traffic loss when prices rise, and more dependent on value platforms to retain frequency.
Labor intensity and mix: Quick service relies heavily on entry-level labor, which is the segment most affected by minimum wage increases. Full-service restaurants have a higher proportion of tipped employees, which partially offsets wage pressure through a different cost structure.
Product mix: Quick-service menus are typically beef-forward and commodity-concentrated, which amplifies exposure to protein price swings. Full-service menus tend to be more diversified across proteins and preparation styles, providing a natural hedge.
Industry analysts note that price hikes alone are no longer reliably sustainable in quick service. Chains are shifting toward retooled value platforms, restructuring affordable bundles, and simplifying price architecture rather than relying on across-the-board menu lifts. This is a structural shift in how the category manages inflation, not a temporary promotional response.
How operators are managing menu inflation right now
The operators holding margin without losing traffic are not the ones raising prices the most aggressively. They are the ones executing more precisely. NRN’s practitioner reporting documents a clear pattern: successful operators have shifted from one-off price hikes to tighter operational execution and earlier cost-catch systems.
Here is the prioritized approach most effective operators are using:
- Phased price increases by market. Rather than system-wide lifts, operators are testing price changes in specific markets first, measuring traffic elasticity, and rolling out only what the data supports.
- Value platform engineering. Structured bundles (a protein, a side, and a drink at a fixed price point) protect frequency among price-sensitive customers without discounting the full menu.
- Menu simplification. Reducing SKU count cuts prep complexity, lowers waste, and concentrates purchasing volume on fewer items, which improves vendor negotiating leverage.
- Portion calibration. Adjusting portion sizes on high-cost ingredients, particularly beef and premium proteins, can preserve margin without a visible price increase. This requires careful execution to avoid a customer perception problem.
- Vendor renegotiation and contract timing. Operators with visibility into commodity forecasts can lock in contracts before projected price increases materialize. The USDA’s beef and veal projections give a planning window.
- Inventory forecasting and waste reduction. Technology-enabled inventory tools reduce over-ordering and spoilage, which directly improves food cost percentage without touching the menu price.
Pro Tip: A/B test pricing cadence by market before any system-wide rollout. A 3% increase in a high-income urban market may produce no measurable traffic decline, while the same increase in a price-sensitive suburban market could cost you 5–8% of visits. The data exists at the unit level; use it.
Pro Tip: Pilot time-limited value bundles in two or three units before committing to a chainwide value platform. The bundle that works in a college-town location may not resonate in a highway travel-center unit. Small pilots protect the brand from a costly misread.
For the weekly cost-review meeting, the KPIs that matter most are: food cost percentage, labor cost percentage, average check size, transaction count, and same-store sales split between price and traffic. If average check is rising while transactions are falling, the pricing strategy is working against volume recovery.
What the near-term outlook looks like for menu inflation
Three scenarios are plausible for the next 12 months, each with a different operational implication.
-
Moderation continues: Monthly menu inflation stays near 0.1–0.2%, annual rate drifts toward 2.5–3.0%. Driver: labor cost growth slows as wage legislation stabilizes; commodity prices hold near current levels. Implication: operators should prioritize traffic recovery over further price increases. Same-store sales growth needs to come from transactions, not check size.
-
Re-acceleration: Monthly rate climbs back toward 0.4–0.5%, annual rate moves above 4%. Driver: renewed commodity spike (beef, eggs) or another round of state minimum wage increases hitting simultaneously. Implication: accelerate margin-protecting levers now, before the cost hits. Operators who wait for the P&L to show the problem are already behind.
-
Commodity-driven spike: A specific protein category (beef, poultry) experiences a supply shock, pushing food cost percentage up 200–300 basis points in a single quarter. Driver: disease outbreak, weather event, or trade disruption. Implication: menu engineering and substitution become urgent. Operators with diversified protein menus and flexible sourcing contracts are better positioned.
The USDA’s projected beef and veal increase of approximately 7.5% for 2026 makes the commodity-driven scenario more than theoretical for burger-focused chains. Poultry and egg supply disruptions have shown they can move fast. Operators who treat the moderation scenario as the only scenario are taking on unpriced risk.
How menu inflation connects to franchise economics and investor signals
For investors tracking quick-service stocks, menu inflation is not just an operational story. It is a revenue and margin signal with direct implications for franchised-model economics.
In a predominantly franchised system, royalties are calculated as a percentage of gross sales. When menu prices rise, top-line royalty revenue increases even if transaction counts are flat or declining. This creates a short-term revenue tailwind for the franchisor that can mask underlying traffic weakness. The critical distinction for investors is whether same-store sales growth is coming from higher average check or from more transactions. Check-driven growth is less durable than traffic-driven growth, and the two tell very different stories about brand health.
The investor checklist for monitoring menu inflation’s impact on a franchised QSR:
- Same-store sales growth: split between price/mix and traffic. Traffic decline with check growth is a warning sign.
- Average check size: rising check with flat or falling traffic signals pricing-led growth, not demand-led growth.
- Food cost percentage: measures how much of revenue is consumed by ingredient costs. Watch for compression when commodity prices spike.
- Labor cost percentage: the most persistent cost pressure in quick service; track against revenue growth.
- Operating margin: the net result of all cost pressures; compare against restaurant operating margin benchmarks to assess relative performance.
- Free cash flow: for franchised systems, free cash flow is the cleaner measure of financial health than reported earnings, because royalty and rent structures can obscure unit-level economics.
AI-enabled drive-thru automation, such as FreshAI-type systems, introduces a structural variable into this analysis. By reducing labor hours per transaction, these systems lower the sensitivity of unit economics to wage-driven menu inflation over time. The near-term effect depends on rollout scale and capital intensity, but operators and investors who track AI automation’s impact on fast food labor costs are watching a lever that could meaningfully change the cost structure of quick service over the next three to five years. For a detailed look at how QSR profitability metrics translate these dynamics into trackable numbers, Buywendys covers the full framework.
How the article’s numbers were compiled
The figures in this article draw from five primary sources:
- BLS CPI “food away from home” series: monthly release; the most granular official breakdown of restaurant price inflation by service type.
- National Restaurant Association menu-price tracker: aggregates BLS data with industry context; updated monthly.
- Toast median menu-item price dataset: reported through trade press and the Food Institute; provides item-level price benchmarks.
- USDA Food Price Outlook: commodity and food-category forecasts updated periodically; the beef and veal projections cited here reflect the 2026 outlook.
- Nation’s Restaurant News and Food Institute: industry reporting on operator practices and analyst commentary.
Month-over-month and year-over-year percentages are taken directly from official BLS and NRA releases. No cross-index blending was used. For monthly updates, the BLS releases its CPI data approximately two weeks after the reference month ends. The NRA publishes its menu-price tracker shortly after each BLS release. The USDA Food Price Outlook updates quarterly.
The levers that matter most this quarter
The moderation in monthly menu inflation is real, but it does not mean the pressure is gone. Pricing cadence, value engineering, and labor efficiency are the three levers that separate operators who protect margin from those who erode it. Pricing cadence matters because the era of large, infrequent price increases is over. Consumers notice, and traffic data shows they respond. Value engineering matters because frequency is the economic engine of quick service, and a customer who visits twice a week instead of three times is a structural revenue problem, not a promotional one. Labor efficiency matters because it is the one cost that does not normalize on its own.
For investors, the operators who execute well on these three dimensions are building durable unit economics, not just managing a cost cycle. That execution shows up in free cash flow, traffic trends, and operating margin before it shows up in the stock price.
Buywendys: deeper analysis for operators and investors
Buywendys publishes regular data-driven analysis on Wendy’s franchise economics, menu pricing dynamics, and QSR investment signals. If the numbers in this article raised questions about how menu inflation translates into stock performance or unit-level returns, the fast food stock investment research guide is the right next read. You will find sourced breakdowns of royalty mechanics, same-store sales interpretation, and the investor metrics that matter most when menu inflation is the dominant variable.
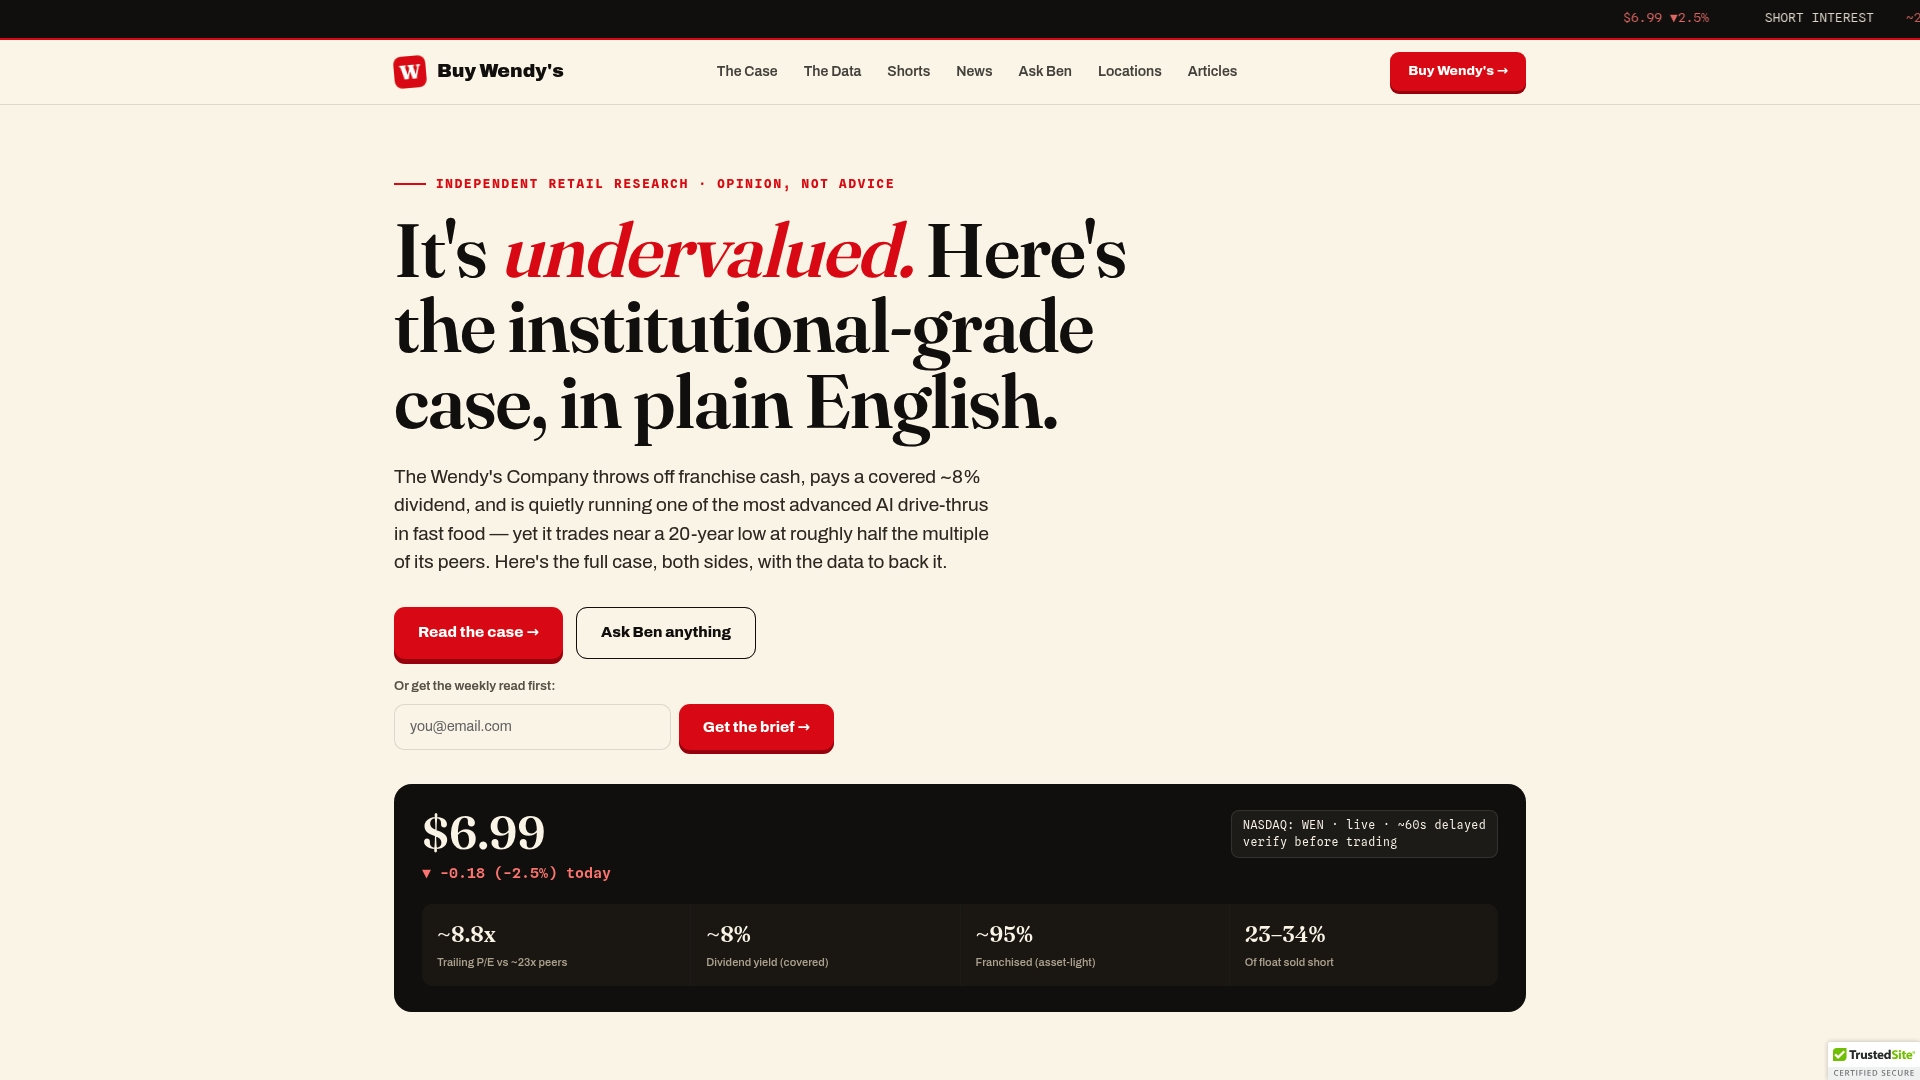
For investors tracking WEN specifically, Buywendys covers the full picture: from AI drive-thru revenue impact to valuation models and margin benchmarks. Start with the fast food stocks to watch overview for context on how Wendy’s sits within the broader sector.
Sources
- Menu Prices | Economic Indicators | Research
- Inflation Reality Check: While CPI Cools, Food Costs Keep Cooking
- Inflation Hits the Menu
- Why fast-food price increases have surpassed overall inflation