
Wendy’s adjusted EBITDA is contracting. Full-year 2025 adjusted EBITDA came in at $522.4 million, and the company’s 2026 guidance range of $460–$480 million implies a further decline of roughly 8–12% year over year. That is not a rounding error. It signals a period of genuine margin pressure driven by weaker systemwide sales, deteriorating company-operated restaurant margins, and elevated G&A, with no near-term catalyst yet confirmed to reverse the trend.
Key headline figures at a glance:
- Q4 2025 adjusted EBITDA: $113.3 million; Full-year 2025 adjusted EBITDA: $522.4 million (per the company’s IR release)
- Q1 2026 adjusted EBITDA: $111.3 million, a significant year-over-year decline; Q2 2026 adjusted EBITDA: $124.1 million, with global systemwide sales declining and U.S. systemwide sales falling notably
The single most consequential data point: Q1 2026 adjusted EBITDA fell by a significant margin year over year, with U.S. company-operated restaurant margin compressing substantially in a single quarter.
Key Takeaways
| Point | Details |
|---|---|
| EBITDA is contracting | FY 2025 adjusted EBITDA was $522.4M; 2026 guidance of $460–$480M implies an ~8–12% further decline. |
| Primary drivers are traffic and margin | Lower franchise royalty revenue and U.S. company-operated margin compression (11.4% in Q1 2026, down from 14.8%) are the two highest-leverage headwinds. |
| Leverage is elevated | Debt-to-EBITDA reached 9.06 as of March 2026, above its ten-year median, limiting financial flexibility during the contraction. |
| Valuation multiple is compressed | LTM EV/EBITDA of ~10.9x sits well below the 2022–2025 fiscal-year average of ~15.1x; multiple re-rating depends on EBITDA recovery confirmation. |
| Buywendys models the scenarios | Buywendys’s fundamental analysis report provides adjusted EBITDA scenarios, EV/EBITDA sensitivity tables, and FCF projections tied to the metrics in this checklist. |
Where to verify these numbers and read the primary documents
| Source | What it contains | Where to find it |
|---|---|---|
| Wendy’s IR (irwendys.com) | Quarterly and full-year adjusted EBITDA, management commentary, 2026 guidance, GAAP reconciliation | Q2 2026, Q1 2026, and Q4/FY 2025 press releases under “News” |
| PR Newswire | Mirror of IR releases with adjusted EBITDA drivers and guidance narrative | Search “Wendy’s Company Reports” on prnewswire.com |
| Macrotrends | Annual EBITDA series 2012–2025 and quarterly EBITDA values | macrotrends.net/stocks/charts/WEN/wendys/ebitda |
| SEC EDGAR | 10-Q and 10-K with formal GAAP-to-adjusted-EBITDA reconciliation | Search ticker “WEN” at sec.gov/cgi-bin/browse-edgar |
| Finbox | LTM and fiscal-year EV/EBITDA multiples | finbox.com/NASDAQGS:WEN/explorer/ev_to_ebitda_ltm |
| GuruFocus | Debt-to-EBITDA ratio and ten-year median | gurufocus.com/term/debt-to-ebitda/WEN |
To locate the formal reconciliation on SEC EDGAR: go to sec.gov, enter “WEN” in the company search, filter by filing type “10-Q” or “10-K,” open the most recent filing, and search the document for “Reconciliation of Net Income to Adjusted EBITDA.” The same reconciliation table appears in Exhibit 99.1 of the 8-K filed on each earnings date.
This article is general information, not a substitute for advice from a qualified financial advisor. Consult a qualified financial professional about your own circumstances before acting on anything here.
Table of Contents
- What Are Wendy’s Adjusted EBITDA Headline Numbers Right Now?
- How Has Wendy’s EBITDA Trended From 2012 to 2026?
- What Is Actually Driving the Decline in Adjusted EBITDA?
- Investor Checklist: What to Model and Monitor
- What the EBITDA Pattern Actually Means for Medium-Term Investors
- Wendy’s EBITDA Models and Valuation Scenarios, Built for Analysts
- Sources
What Are Wendy’s Adjusted EBITDA Headline Numbers Right Now?
The table below consolidates the most recent reported periods using figures from Wendy’s investor relations releases and SEC filings. Adjusted EBITDA differs from reported (GAAP) EBITDA primarily because the company excludes advertising fund contributions and expenses, certain franchise fee recognition items, and discrete one-time charges such as restructuring costs and legal settlements.
| Period | Adjusted EBITDA ($M) | YoY Change |
|---|---|---|
| Q2 2026 | $124.1 | Decline vs. Q2 2025 |
| Q1 2026 | $111.3 | a double-digit decline |
| Q4 2025 | $113.3 | Decline compared to prior year quarter |
| Full-Year 2025 | $522.4 | Decline compared to prior year |
| 2026 Guidance | $460–$480 | ~8–12% below FY 2025 |
Three adjustments consistently bridge GAAP to adjusted EBITDA in Wendy’s filings:
- Advertising fund netting: The company consolidates its advertising funds, which can inflate or deflate reported EBITDA depending on fund timing. Adjusted EBITDA strips this out to show the underlying franchise economics.
- Franchise fee recognition: Upfront franchise fees are recognized over the contract term under ASC 606. Adjusted EBITDA typically excludes the non-cash amortization component to reflect cash-generative capacity.
- One-time items: Restructuring charges, legal provisions, and impairment charges are excluded from adjusted EBITDA. Provisions for doubtful accounts have recently added non-operational volatility to quarterly figures.
Calculating EBITDA margin: Wendy’s FY 2025 revenue was approximately $2.18 billion. Analysts who prefer a systemwide sales denominator (which includes franchisee-level sales not consolidated on the income statement) will arrive at a materially lower margin percentage, so always confirm which denominator a published margin figure uses before inserting it into a model.
How Has Wendy’s EBITDA Trended From 2012 to 2026?
Macrotrends’ annual and quarterly EBITDA series for Wendy’s provides the longest continuous public dataset, covering 2012 through the most recent quarters. The series reveals three distinct phases.
| Year | Annual EBITDA (approx., $M) |
|---|---|
| 2012 | ~$270 |
| 2013 | ~$285 |
| 2014 | ~$295 |
| 2015 | ~$310 |
| 2016 | ~$370 |
| 2017 | ~$395 |
| 2018 | ~$410 |
| 2019 | ~$430 |
| 2020 | ~$395 |
| 2021 | ~$460 |
| 2022 | ~$490 |
| 2023 | ~$510 |
| 2024 | ~$535 |
| 2025 | $522.4 (reported) |
Note: 2012–2024 figures are approximate values from the Macrotrends historical series. The 2025 figure is the company-reported adjusted EBITDA. Analysts should verify each annual figure against the corresponding 10-K reconciliation on SEC EDGAR before using in models.
Phase 1 (2012–2019): Steady expansion. The franchise refranchising program, which converted company-operated restaurants to franchised units, steadily shifted the revenue mix toward higher-margin royalty income. EBITDA grew at a measured pace through this period, with the 2016–2017 window showing the sharpest single-year acceleration as refranchising completed.
Phase 2 (2020–2024): Recovery and peak. The 2020 dip reflected COVID-19 disruption to systemwide sales and temporary royalty relief extended to franchisees. Recovery was swift, and EBITDA reached its recent peak in the 2023–2024 range near $535 million.
Phase 3 (2025–2026): Contraction. FY 2025 marked the first meaningful annual decline in the post-COVID series, and the 2026 guidance range implies the contraction deepens before any recovery materializes.
Inflection point to flag: The 2020 COVID trough represented roughly a 8% single-year decline. The 2025–2026 drawdown, if guidance midpoint ($470 million) is realized, would represent a cumulative decline of approximately 12% from the 2024 peak, making it the steeper of the two contractions in the modern franchise era.
Segment reclassifications and the advertising fund consolidation under ASC 606 affect comparability across the full series. When modeling years prior to 2019, treat pre-refranchising EBITDA as structurally different from the current predominantly franchised base, and adjust for the higher company-operated restaurant count that inflated revenue but compressed margins in earlier periods.
What Is Actually Driving the Decline in Adjusted EBITDA?
The proximate causes are well-documented across recent earnings releases and can be grouped into revenue-side and cost-side pressures.
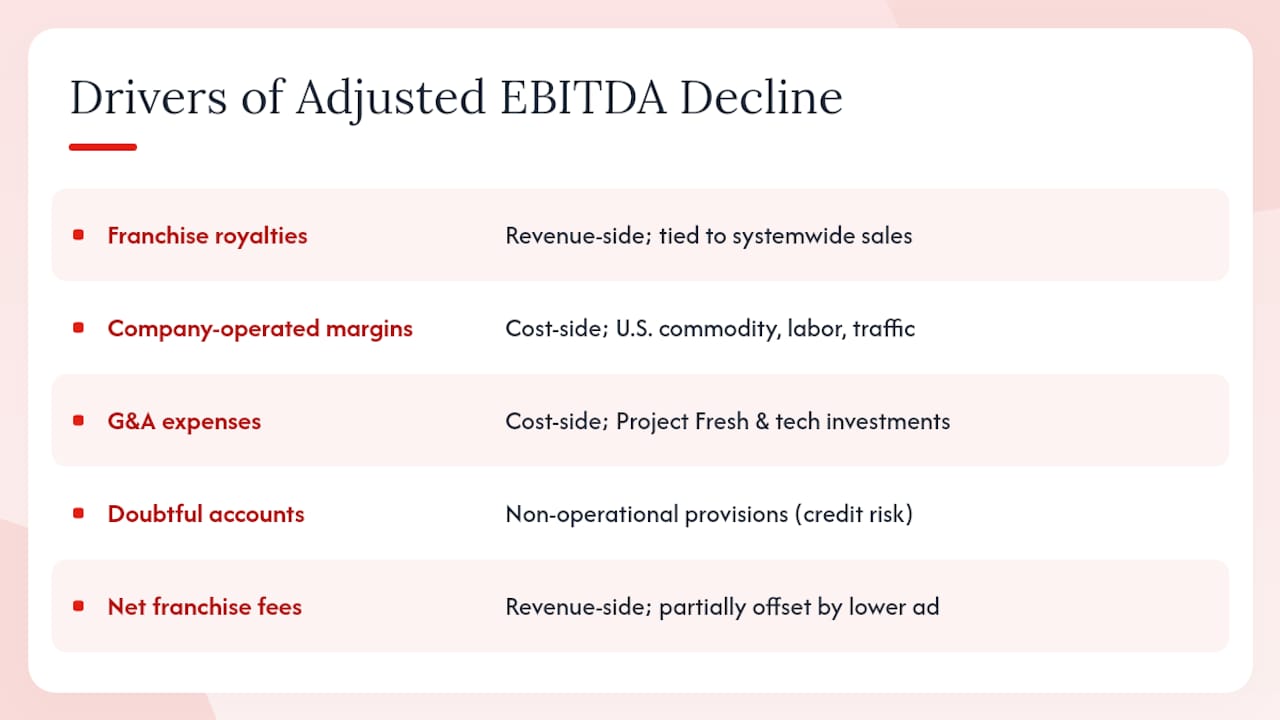
Management’s Q2 2026 commentary identified four primary drivers: lower franchise royalty revenue, decreased U.S. company-operated restaurant margins, higher G&A expenses, and increased provisions for doubtful accounts. The Q4 and FY 2025 IR release added lower net franchise fees as a fifth factor, partially offset by lower incremental advertising funding.
Breaking each driver down:
Franchise royalty revenue is a direct function of systemwide sales. With U.S.
**U.S. This reflects commodity cost pressure, labor cost inflation, and weaker traffic. Company-operated units represent a minority of the system, but their margin trajectory is a leading indicator for overall franchise health because it signals the unit economics franchisees are experiencing.
G&A has risen partly due to Project Fresh transformation costs and technology investments including FreshAI rollout expenses. These are front-loaded costs intended to generate multi-year systemwide sales benefits, but they weigh on near-term adjusted EBITDA.
Provisions for doubtful accounts have added non-operational noise to quarterly figures. Analysts should strip these when estimating normalized EBITDA for valuation purposes, as they reflect credit risk on franchise receivables rather than underlying operating performance.
Pro Tip: When reading Wendy’s 10-Q filings on SEC EDGAR, focus on the “Segment Information” footnote and the formal GAAP-to-adjusted-EBITDA reconciliation table, typically in the earnings release exhibit. The provision line and advertising fund netting are the two items most likely to distort quarter-to-quarter comparisons. For deeper context on quarterly earnings reconciliations, Buywendys publishes period-by-period walkthroughs that map each adjustment to the relevant filing line.
Investor Checklist: What to Model and Monitor
Translating Wendy’s EBITDA trajectory into a valuation requires tracking a specific set of inputs. The following checklist is ordered by modeling priority.
-
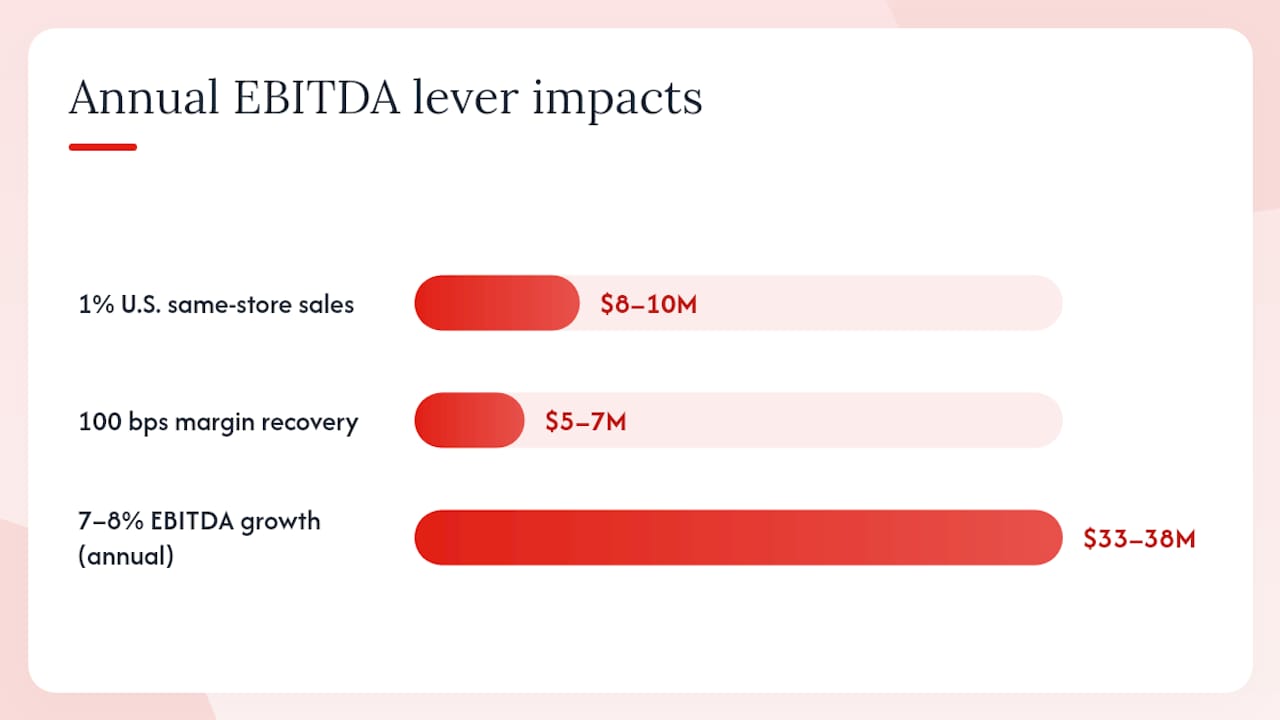
Same-restaurant sales growth (U.S. and international). This is the primary revenue lever for royalty income. A 1% improvement in U.S. same-store sales at the current royalty rate structure adds approximately $8–10 million to annual adjusted EBITDA, though analysts should verify the current royalty rate against the most recent 10-K before applying this sensitivity.
-
U.S. company-operated restaurant margin. At 11.4% in Q1 2026, this metric is well below the mid-teens levels seen in 2023–2024. A 100 basis-point recovery in this margin on the current company-operated revenue base adds roughly $5–7 million to adjusted EBITDA annually. Sustained recovery above 13% would signal that commodity and labor headwinds are abating.
-
Franchise royalty revenue trend. Monitor the royalty rate and systemwide sales together. Royalty income flows almost entirely to EBITDA, making it the highest-leverage line in the model.
-
Net franchise fees. These declined in FY 2025 and reflect the pace of new restaurant openings and closures. A slowdown in net new unit growth directly reduces this revenue stream.
-
G&A trajectory. Management has guided toward G&A discipline as Project Fresh matures. Watch for G&A as a percentage of revenue to stabilize or decline as transformation costs roll off.
-
Capital expenditure and free cash flow. Free cash flow is the metric that ultimately supports the dividend and debt service. Elevated capex tied to FreshAI and restaurant reimaging programs compresses near-term free cash flow even when adjusted EBITDA is stable.
-
Debt-to-EBITDA. As of March 2026, Wendy’s debt-to-EBITDA stood at 9.06, roughly 14% above its ten-year median of 7.95. With EBITDA contracting and debt levels elevated, this ratio is moving in the wrong direction. A ratio above 9x at the guidance midpoint EBITDA of $470 million warrants close attention from credit-sensitive investors.
-
Provisioning trends. Elevated provisions for doubtful accounts can signal franchisee financial stress. If provisions persist or grow, they may foreshadow royalty collection issues that would further compress adjusted EBITDA.
-
2026 guidance vs. actuals. The company guided $460–$480 million for full-year 2026 adjusted EBITDA. With Q1 at $111.3 million and Q2 at $124.1 million, the first-half total is the sum of these figures. Reaching the guidance midpoint requires roughly $234–$245 million in the second half, implying a meaningful sequential improvement. Track whether H2 2026 quarterly releases confirm that acceleration.
Pro Tip: Wendy’s long-term adjusted EBITDA growth target of roughly 7–8% annually, set at the 2025 Investor Day, provides a useful scenario anchor. In a bull case where execution normalizes by 2027–2028, applying that growth rate to a $470 million 2026 base implies adjusted EBITDA of approximately $540–$560 million within two years. In a bear case where same-store sales remain negative and G&A stays elevated, the 2026 guidance range itself may prove optimistic. Model both scenarios and weight them by your assessment of management’s execution credibility under the current leadership team.
Valuation context: Wendy’s LTM EV/EBITDA is approximately 10.9x, compared to a fiscal-year average of ~15.1x across 2022–2025. The compression in the multiple reflects both EBITDA contraction and market skepticism about the recovery timeline. Understanding how EV/EBITDA functions as a valuation multiple is useful context before applying these figures to a DCF or comparable-company analysis. If EBITDA recovers toward $520–$540 million and the multiple re-rates toward its historical average, the implied enterprise value expansion is material. If EBITDA stays near guidance midpoint and the multiple stays compressed, the stock’s upside is limited.
Data definitions, reconciliation approach, and primary sources
Transparency about data choices allows analysts to reproduce the series and identify where figures may diverge across sources.
Primary sources by figure type:
- Quarterly and full-year adjusted EBITDA (2025–2026): Wendy’s IR press releases (irwendys.com) and PR Newswire distributions. These are the authoritative figures for adjusted EBITDA because they include the formal GAAP-to-adjusted reconciliation table.
- Historical annual EBITDA series (2012–2024): Macrotrends (macrotrends.net/stocks/charts/WEN/wendys/ebitda). Note that Macrotrends reports EBITDA on a GAAP basis derived from SEC filings; figures may differ modestly from company-reported adjusted EBITDA due to the exclusion of advertising fund items and one-time charges.
- GAAP reconciliations: SEC EDGAR 10-Q and 10-K filings. The formal reconciliation of net income to adjusted EBITDA appears in the earnings release exhibit attached to each 8-K filing, and in the non-GAAP reconciliation table within the 10-Q/10-K.
- Revenue figures: Stock Analysis (stockanalysis.com) for quarterly and annual revenue, cross-referenced against SEC filings.
- Valuation multiples: Finbox (finbox.com) for LTM and fiscal-year EV/EBITDA.
- Leverage ratios: GuruFocus (gurufocus.com) for debt-to-EBITDA.
Methodology notes: Across the historical series, the 2016–2019 period reflects the refranchising transition, during which company-operated restaurant count declined sharply. EBITDA figures from that period are not directly comparable to the current predominantly franchised base without adjusting for the revenue mix shift. The advertising fund consolidation under ASC 606 (effective 2019) also altered reported revenue and EBITDA; pre-2019 figures should be treated as a different accounting basis when computing multi-year CAGR.
Where to find the GAAP reconciliation: In each quarterly 10-Q and annual 10-K filed on SEC EDGAR, search for “Reconciliation of Net Income to Adjusted EBITDA” in the non-GAAP financial measures section or the earnings release exhibit (Exhibit 99.1 of the associated 8-K). This table is the definitive source for the adjustments the company applies each period.
Statistic to anchor the series: The 2025 full-year adjusted EBITDA of $522.4 million represents the first annual decline from the post-COVID recovery peak, and the 2026 guidance midpoint of $470 million would mark the lowest annual adjusted EBITDA since approximately 2021, based on the Macrotrends historical series.
What the EBITDA Pattern Actually Means for Medium-Term Investors
The conventional read on Wendy’s current EBITDA softness is that it is cyclical: commodity costs will normalize, traffic will recover, and the franchise model’s inherent operating leverage will amplify the rebound. That view is not wrong, but it understates the execution risk embedded in the current setup.
The more precise concern is that two of the four primary EBITDA headwinds, lower franchise royalty revenue and compressed company-operated margins, are both downstream of the same problem: declining customer traffic. FreshAI and menu innovation are intended to address that traffic problem, but they are front-loading costs now while the revenue benefit remains uncertain in timing and magnitude. That asymmetry, costs certain, benefits contingent, is what separates a temporary dip from a structural reset.
For medium-term investors, the monitoring triggers are specific. Franchise royalty revenue stabilizing on a quarter-over-quarter basis would be the first signal that the traffic decline has bottomed. An upward guidance revision from the $460–$480 million range would indicate management has regained confidence in the execution path. Until at least two of those three triggers are confirmed, treating the EBITDA contraction as fully priced in requires a high conviction view on the recovery timeline that the current data does not yet support.
The international growth pipeline and FreshAI’s potential efficiency gains represent genuine optionality. They are not reasons to dismiss the near-term pressure, but they are reasons not to write off the long-term thesis either.
Wendy’s EBITDA Models and Valuation Scenarios, Built for Analysts
Analysts who want to move from the data above to a working valuation model have a faster path through Buywendys. The platform’s fundamental analysis report maps directly to the checklist in this article: it covers adjusted EBITDA scenarios, EV/EBITDA sensitivity tables, free cash flow projections, and debt-to-EBITDA stress tests under both bull and bear assumptions.
For investors weighing whether current market pricing reflects the EBITDA risk, Buywendys’s latest valuation analysis translates the $460–$480 million guidance range into enterprise value scenarios using the LTM and historical EV/EBITDA multiples covered above. The analysis is updated as new quarterly results are released, so the figures stay current with each earnings cycle. Visit Buywendys to access the full report and scenario models.
Sources
- THE WENDY’S COMPANY REPORTS SECOND QUARTER 2026 RESULTS