For income investors seeking dependable yield from the restaurant sector, the strongest starting position is McDonald’s (MCD), followed closely by Yum! Brands (YUM) and Restaurant Brands International (QSR). All three operate predominantly franchised systems, which generate royalty and rent income that is structurally more predictable than company-operated restaurant margins. The top dividend-paying restaurant stocks across multiple screens consistently include these ten names:
- McDonald’s (MCD) — 49 consecutive years of dividend raises; ~95% franchised; the clearest defensive income case in the sector
- Yum! Brands (YUM) — KFC, Pizza Hut, and Taco Bell under one roof; broad international exposure with consistent payout growth
- Restaurant Brands International (QSR) — Burger King, Tim Hortons, and Popeyes; $2.60 annual dividend with a ~3.6% yield
- Domino’s (DPZ) — Supply-chain advantages amplify franchise cash flow; steady dividend with growth potential
- Starbucks (SBUX) — Loyalty-driven demand and product premiumization support a moderate, growing dividend
- Wendy’s (WEN) — High-yield profile with a predominantly franchised model; turnaround catalysts including FreshAI
- Papa John’s (PZZA) — Mid-to-high yield; more operationally sensitive but attractive for yield seekers
- Jack in the Box (JACK) — Regional QSR with steady mid-cap dividend income
- Nathan’s Famous (NATH) — Small-cap; dividend growth from a low base; speculative income play
- Arcos Dorados (ARCO) — McDonald’s largest independent operator in Latin America; annual dividend policy; geographic diversification
Fast-food chains tend to hold up better than casual dining during economic downturns because consumers trade down to quick-service options. Pair that with the royalty-style cash flows of franchise-heavy operators and you have a sector that can sustain dividends through cycles that punish other consumer stocks.
Key Takeaways
McDonald’s, Yum! Brands, and Restaurant Brands International are the strongest defensive dividend picks in the restaurant sector because their near-total franchise models generate royalty income that is structurally more resilient than company-operated restaurant margins.
| Point | Details |
|---|---|
| Franchise model = dividend durability | Royalty-and-rent franchisors (MCD, YUM, QSR) produce more predictable FCF than owner-operators. |
| MCD leads on safety | 49 consecutive dividend raises and ~95% franchised make MCD the sector’s lowest-risk income position. |
| WEN offers the highest yield | ~5.5% yield with an 80–90% payout ratio; FreshAI is a real catalyst, but the cushion is thin. |
| $1,000/month capital math | At a 3.0% yield (SBUX), you need ~—; at 5.5% (WEN), — in capital. |
| Buywendys for WEN depth | Buywendys provides dedicated FCF modeling, payout-ratio stress tests, and FreshAI deployment analysis for WEN investors. |
Table of Contents
- How the best restaurant dividend stocks compare at a glance
- Per-stock profiles: dividend reliability and key risks
- How these stocks were screened and selected
- How much capital do you need to generate $1,000 per month from restaurant dividends?
- Risks and red flags to monitor each quarter
- Wendy’s (WEN): a closer look at dividend outlook and FreshAI
- What Buywendys offers income investors tracking WEN
- The case for franchisor-first dividend investing: an editorial perspective
- Sources
How the best restaurant dividend stocks compare at a glance
Data reflects publicly available figures as of mid-2026. Yields and payout ratios fluctuate; verify current figures via company IR pages or SEC filings before acting.
| Ticker | Approx. Yield | Payout Ratio | Dividend Growth | FCF Signal | Business Model | Best For |
|---|---|---|---|---|---|---|
| MCD | ~2.7% | ~55–60% | 49 consecutive raises | Strong; royalty-driven FCF | ~95% franchised | Defensive dividend income |
| YUM | ~2.0% | ~55% | 10+ years of raises | Solid; multi-brand royalties | ~98% franchised | Dividend growth + intl. exposure |
| QSR | ~3.6% | ~65% | Consistent since 2014 | Adequate; multi-brand scale | ~100% franchised | Diversified franchisor exposure |
| DPZ | lower yield | payout ratio somewhat elevated | steady dividend growth | Strong; supply-chain margin lift | mostly franchised | Stability with growth potential |
| SBUX | moderate yield | payout ratio moderate | steady dividend growth | Moderate; loyalty-driven | Mix of company and licensed stores | Dividend growth, secular demand |
| WEN | higher yield | payout ratio elevated | dividends maintained | Adequate; franchise royalties | most units franchised | High yield with turnaround upside |
| PZZA | mid yield | payout ratio elevated | dividends reinstated and growing | Moderate; marketing-sensitive | partly franchised | Yield seekers, with higher risk tolerance |
| JACK | mid yield | payout ratio moderate | steady dividend | Moderate | mix of company and franchised units | Regional QSR income exposure |
| NATH | lower yield | payout ratio conservative | dividend growth from low base | Adequate; niche retail | Franchise and retail licensing | Small-cap speculative income |
| ARCO | moderate yield | payout ratio variable | annual dividend policy | Moderate; Latin America exposure | Operates McDonald’s company-operated units | Geographic diversification |
Yield outlier note: Wendy’s ~5.5% yield stands out as the highest among franchise-heavy operators. A payout ratio in the 80–90% range signals limited cushion if earnings decline, making dividend safety analysis the critical first step before sizing a WEN position.
The Dividend and WallStreetZen both confirm that payout ratios and FCF coverage vary widely across the sector, making stock selection far more consequential than simply buying the highest yield.
Per-stock profiles: dividend reliability and key risks
McDonald’s (MCD)
McDonald’s is the benchmark for defensive dividend income in the restaurant sector. With ~95% of its restaurants franchised at end-2025 and 49 consecutive years of dividend raises, MCD collects royalties and rent from franchisees rather than absorbing direct restaurant-level cost volatility. The quarterly payout per share at a yield near 2.7% is not the highest in the group, but the combination of payout consistency, FCF coverage, and near-Dividend-Aristocrat status makes it the lowest-risk income position in the sector. The primary risk is a prolonged value-war cycle that pressures franchisee profitability and, eventually, system-wide sales.
Best for: Investors who prioritize dividend reliability over yield magnitude.
Yum! Brands (YUM)
Yum! Brands operates KFC, Pizza Hut, and Taco Bell across roughly 55,000 locations globally, with approximately 98% franchised. That near-total franchise mix produces royalty streams across three distinct consumer occasions, which smooths revenue relative to single-brand operators. Yum! has delivered more than a decade of consecutive dividend raises, and its international footprint provides exposure to faster-growing markets that can offset domestic softness. Leverage is meaningful, so watch debt-service costs against FCF when rates remain elevated.
Best for: Dividend growth investors who want international diversification inside a single ticker.
Restaurant Brands International (QSR)
QSR’s $2.60 annual dividend and ~3.6% yield make it one of the more attractive yield-to-safety combinations in the group. The company operates Burger King, Tim Hortons, and Popeyes through a fully franchised model, generating royalties and distribution income across three brand architectures. Dividend consistency has been solid since the company’s 2014 formation, though payout ratios near 65% leave less room than MCD or YUM if system sales soften. Tim Hortons’ Canadian concentration and Burger King’s ongoing remodel program are the two variables most worth monitoring.
Best for: Investors seeking a mid-yield franchisor with multi-brand diversification.
Domino’s (DPZ)
Domino’s is unusual among pizza franchisors because it also operates a vertically integrated supply chain, selling dough, sauce, and equipment to its franchisees. That supply-chain margin layer supplements royalty income and provides a FCF buffer that pure franchisors lack. The dividend yield sits near 1.5%, which is modest, but the payout has grown steadily and the underlying cash generation is among the most consistent in the group. Digital ordering penetration above 80% of U.S. sales reduces the revenue volatility that plagued pre-digital pizza chains.
Best for: Investors who prioritize dividend growth and cash-flow quality over current yield.
Starbucks (SBUX)
Starbucks operates a hybrid model: company-owned stores in core markets and licensed units internationally. The loyalty program, with tens of millions of active members, creates a recurring revenue dynamic that most restaurant chains cannot replicate. The dividend yield near 3.0% and 13-plus years of consecutive raises reflect that cash-generation consistency. The risk is that company-operated stores expose Starbucks to direct labor and commodity inflation in ways that pure franchisors avoid. A turnaround under new leadership is underway; execution on traffic recovery is the key catalyst to watch.
Best for: Dividend growth investors comfortable with a mixed company-operated/licensed model.
Wendy’s (WEN)
Wendy’s carries the highest yield in this group at approximately 5.5%, supported by a predominantly franchised model that generates royalties and rent. The payout ratio in the 80–90% range is elevated, which means dividend coverage depends on maintaining or growing system sales and FCF. The Wendy’s vs. McDonald’s comparison illustrates how WEN’s smaller scale and higher leverage create a different risk profile than MCD despite a similar franchise structure. FreshAI drive-thru automation is a genuine operational catalyst that could improve throughput and franchisee margins over time. See the dedicated deep dive below for a fuller treatment.
Best for: High-yield income investors who accept a tighter payout cushion in exchange for a materially higher current yield.
Papa John’s (PZZA)
Papa John’s reinstated and has grown its dividend following a period of management instability, and the yield now sits in the 3.5% range. The franchise mix is approximately 80%, which provides some royalty-income insulation, but the brand’s reliance on promotional intensity to drive traffic makes franchisee margins more sensitive to value-war cycles than Domino’s. FCF coverage is moderate. The risk-reward is appropriate for investors who want above-average yield and accept that the dividend has less historical depth than MCD or YUM.
Best for: Yield-focused investors with a higher tolerance for operational sensitivity.
Jack in the Box (JACK)
Jack in the Box is a regional QSR operator concentrated in the western United States, with a yield near 4.0% and a payout ratio in the 60–70% range. The company has maintained its dividend steadily, and the mid-cap size means less analyst coverage, which occasionally creates valuation inefficiencies. Leverage is a watch item; the company carries meaningful debt relative to its earnings base. The restaurant investment risk profile for regional operators like JACK is more concentrated than national brands.
Best for: Income investors seeking mid-cap QSR yield with a regional brand premium.
Nathan’s Famous (NATH)
Nathan’s Famous operates a small but growing dividend program, with a payout ratio near 40% that provides meaningful coverage headroom. The business combines franchise royalties with a retail licensing model (hot dogs in grocery stores), which diversifies revenue beyond restaurant traffic. The yield near 2.5% is not the highest, but the low payout ratio and dual-revenue model make the dividend more secure than the yield alone suggests. Liquidity is thin; this is a small-cap position that warrants a smaller portfolio allocation.
Best for: Speculative income investors who want small-cap dividend exposure with a conservative payout structure.
Arcos Dorados (ARCO)
Arcos Dorados is McDonald’s largest independent franchisee, operating across 20 Latin American and Caribbean markets. The annual dividend policy means payouts are less predictable quarter-to-quarter than U.S.-listed peers, and the yield near 2.0% reflects that variability. Currency risk is real: earnings are generated in local currencies but reported in U.S. dollars, so exchange-rate movements directly affect dividend purchasing power. The investment case rests on Latin American consumer growth tied to the McDonald’s brand system.
Best for: Investors seeking geographic diversification with McDonald’s brand exposure in emerging markets.
How these stocks were screened and selected
The shortlist above was built using a repeatable, criteria-driven process rather than editorial preference. The primary filters applied were:
- Minimum trailing dividend yield: Stocks paying no dividend or a purely discretionary/irregular dividend were excluded.
- Payout ratio ceiling: Stocks with payout ratios consistently above 100% of trailing earnings were flagged as high-risk and noted as such rather than excluded outright, since FCF coverage can differ from GAAP earnings coverage.
- Free cash flow coverage: Each candidate was assessed for whether FCF (operating cash flow minus capex) covered the annual dividend obligation. Franchisors with royalty-driven FCF received higher safety scores.
- Dividend history consistency: Preference was given to stocks with multi-year records of maintained or growing dividends. Stocks with recent cuts were noted with a risk flag.
- Market capitalization and liquidity: Micro-cap names with thin trading volume were included only where the dividend program was substantive (Nathan’s Famous qualifies on payout-ratio discipline).
- Business model classification: Franchise-heavy operators were weighted more favorably for dividend defensiveness, consistent with the royalty-income principle that underpins MCD’s Dividend Aristocrat candidacy.
Primary data sources include SEC filings and company investor-relations pages, Dividend.com’s restaurant category, WallStreetZen’s restaurant stock screener, Yahoo Finance dividend history records, and InsiderMonkey’s restaurant dividend profiles.
Dividend-safety checklist: Before buying any restaurant dividend stock, verify four things: (1) the trailing payout ratio relative to both GAAP earnings and free cash flow; (2) the trend in franchisee-level profitability, since a squeezed franchisee base eventually pressures system sales and royalty income; (3) the company’s leverage ratio and whether rising interest expense is consuming FCF that would otherwise support the dividend; and (4) the cadence of share buybacks versus dividends, which reveals management’s stated capital-allocation priority.
The restaurant stock valuation metrics that matter most for dividend analysis are FCF yield, net leverage, and system-sales growth — not headline P/E ratios, which can be distorted by depreciation and amortization in franchise-heavy structures.
How much capital do you need to generate $1,000 per month from restaurant dividends?
Generating $1,000 per month ($12,000 per year) from dividends requires a capital base that varies significantly depending on which stocks you hold. The formula is straightforward:
Capital required = Annual income target ÷ Dividend yield
A few practical considerations:
- Tax treatment matters. Qualified dividends from U.S. corporations are taxed at 0%, 15%, or 20% depending on your income bracket, which is more favorable than ordinary income rates. Confirm qualified status with your tax advisor before projecting after-tax income.
- Diversify across yield tiers. Concentrating entirely in WEN to minimize capital required exposes you to a single high-payout-ratio stock. A blended portfolio across MCD, YUM, QSR, and WEN smooths both yield and risk.
- DRIP vs. cash. Dividend reinvestment plans (DRIPs) compound position size over time and are appropriate when you are building toward an income target rather than drawing income now. Switch to cash dividends once you reach your target capital base.
- Yield drift. Stock prices move, so a 5.5% yield today can become 4.0% or 7.0% as the share price changes. Monitor yield on cost versus current yield to track your actual income rate.
The online food delivery market is projected to reach $505.50 billion by 2030, which supports the long-term revenue base for chains that have invested in digital ordering. That secular tailwind is relevant to the capital-needed calculation because it underpins the sales growth that sustains dividend coverage over a multi-year holding period.
Risks and red flags to monitor each quarter
Restaurant dividends are not immune to disruption. The sector-specific risks that most directly threaten payout sustainability are:
- Franchisee margin compression. When value wars intensify (as they did in 2023–2024 across the QSR sector), franchisees absorb the cost of discounting while paying fixed royalties. Sustained margin pressure can lead to unit closures, which directly reduces royalty income for the franchisor.
- Payout ratios approaching earnings limits. A payout ratio above 70–80% of GAAP earnings leaves little buffer if same-store sales decline even modestly. McDonald’s payout ratio has swung from 53% to 68% in just three quarters during periods of earnings pressure, illustrating how quickly the cushion can narrow.
- Commodity and labor inflation. Company-operated chains (Starbucks, Arcos Dorados) face direct exposure. Franchisors face it indirectly through franchisee health.
- Rising leverage. Several names on this list carry significant debt. If interest rates remain elevated, debt-service costs consume FCF that would otherwise support dividends or buybacks.
- Traffic declines. Sustained same-store traffic declines signal a brand health problem that eventually flows through to royalty income.
- Geopolitical and currency risk. Arcos Dorados and Yum! Brands’ international exposure introduces currency translation risk and geopolitical volatility that domestic-only operators avoid.
The growing consumer preference for takeout and delivery is a structural tailwind, but chains that failed to invest in digital infrastructure are increasingly exposed to delivery-platform economics that compress margins rather than expand them.
Pro Tip: For franchisors, the single most predictive quarterly metric for dividend safety is system-sales growth (not same-store sales alone). System-sales growth captures both comp performance and unit-count changes, giving a cleaner picture of royalty income trajectory than any single-store metric.
Wendy’s (WEN): a closer look at dividend outlook and FreshAI
Wendy’s sits at the intersection of high yield and genuine operational catalysts, which is why Buywendys covers it with dedicated analytical depth. The core metrics:
| Metric | WEN (Approximate, Mid-2026) |
|---|---|
| Dividend yield | ~5.5% |
| Payout ratio (trailing) | ~80–90% of GAAP earnings |
| Franchised % | ~95% |
| Business model | Royalties + rent from franchisees |
| FCF coverage | Adequate; royalty-driven |
| Primary risk | Elevated payout ratio; value-war sensitivity |
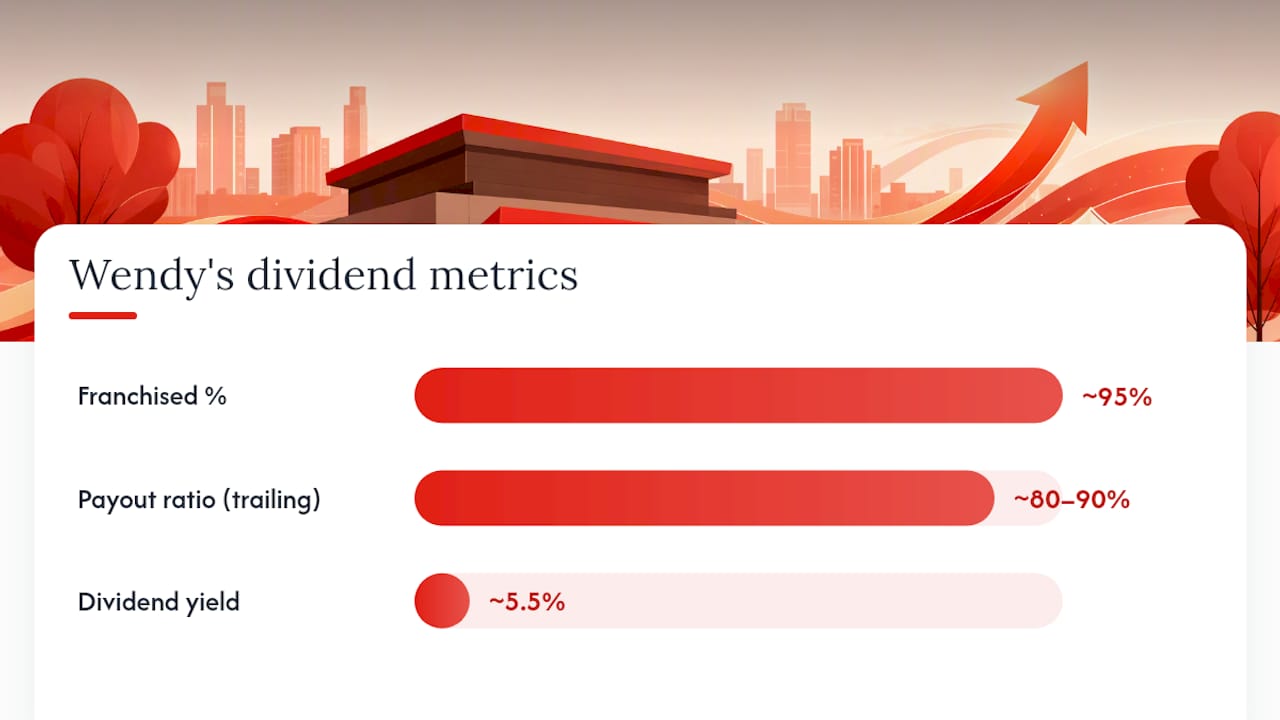
The dividend is supported by a royalty-and-rent structure that insulates it from direct restaurant-level cost volatility. Approximately 95% of Wendy’s units are franchised, meaning the company collects fees regardless of whether individual franchisees are having a strong quarter. That structural insulation is the primary reason the dividend has been maintained despite a challenging same-store sales environment.
FreshAI, Wendy’s generative AI drive-thru ordering system, is a genuine margin lever rather than a marketing initiative. By reducing order errors and improving throughput speed, FreshAI can lower labor costs per transaction at the drive-thru window. For franchisees, that translates into improved unit economics, which is directly relevant to dividend sustainability: healthier franchisees are less likely to close units, and a growing unit count expands the royalty base. The FreshAI drive-thru impact on WEN’s investor case is a topic Buywendys tracks with proprietary analysis updated as deployment data becomes available.
The primary risk remains the payout ratio. At 80–90% of GAAP earnings, there is limited room for an earnings miss before the dividend comes under pressure. Investors should monitor quarterly FCF relative to the annual dividend obligation rather than relying solely on the GAAP payout ratio, since franchise royalties tend to be more stable than GAAP earnings suggest.
Pro Tip: Track Wendy’s system-sales growth and franchisee-level EBITDA margins each quarter. A sustained decline in either signals that the royalty base is under pressure, which is the earliest warning sign for dividend risk at WEN.
For a full bull-versus-bear analysis of WEN’s dividend sustainability, the Wendy’s fundamental analysis report covers FCF modeling, payout-ratio stress tests, and FreshAI deployment scenarios in detail.
What Buywendys offers income investors tracking WEN
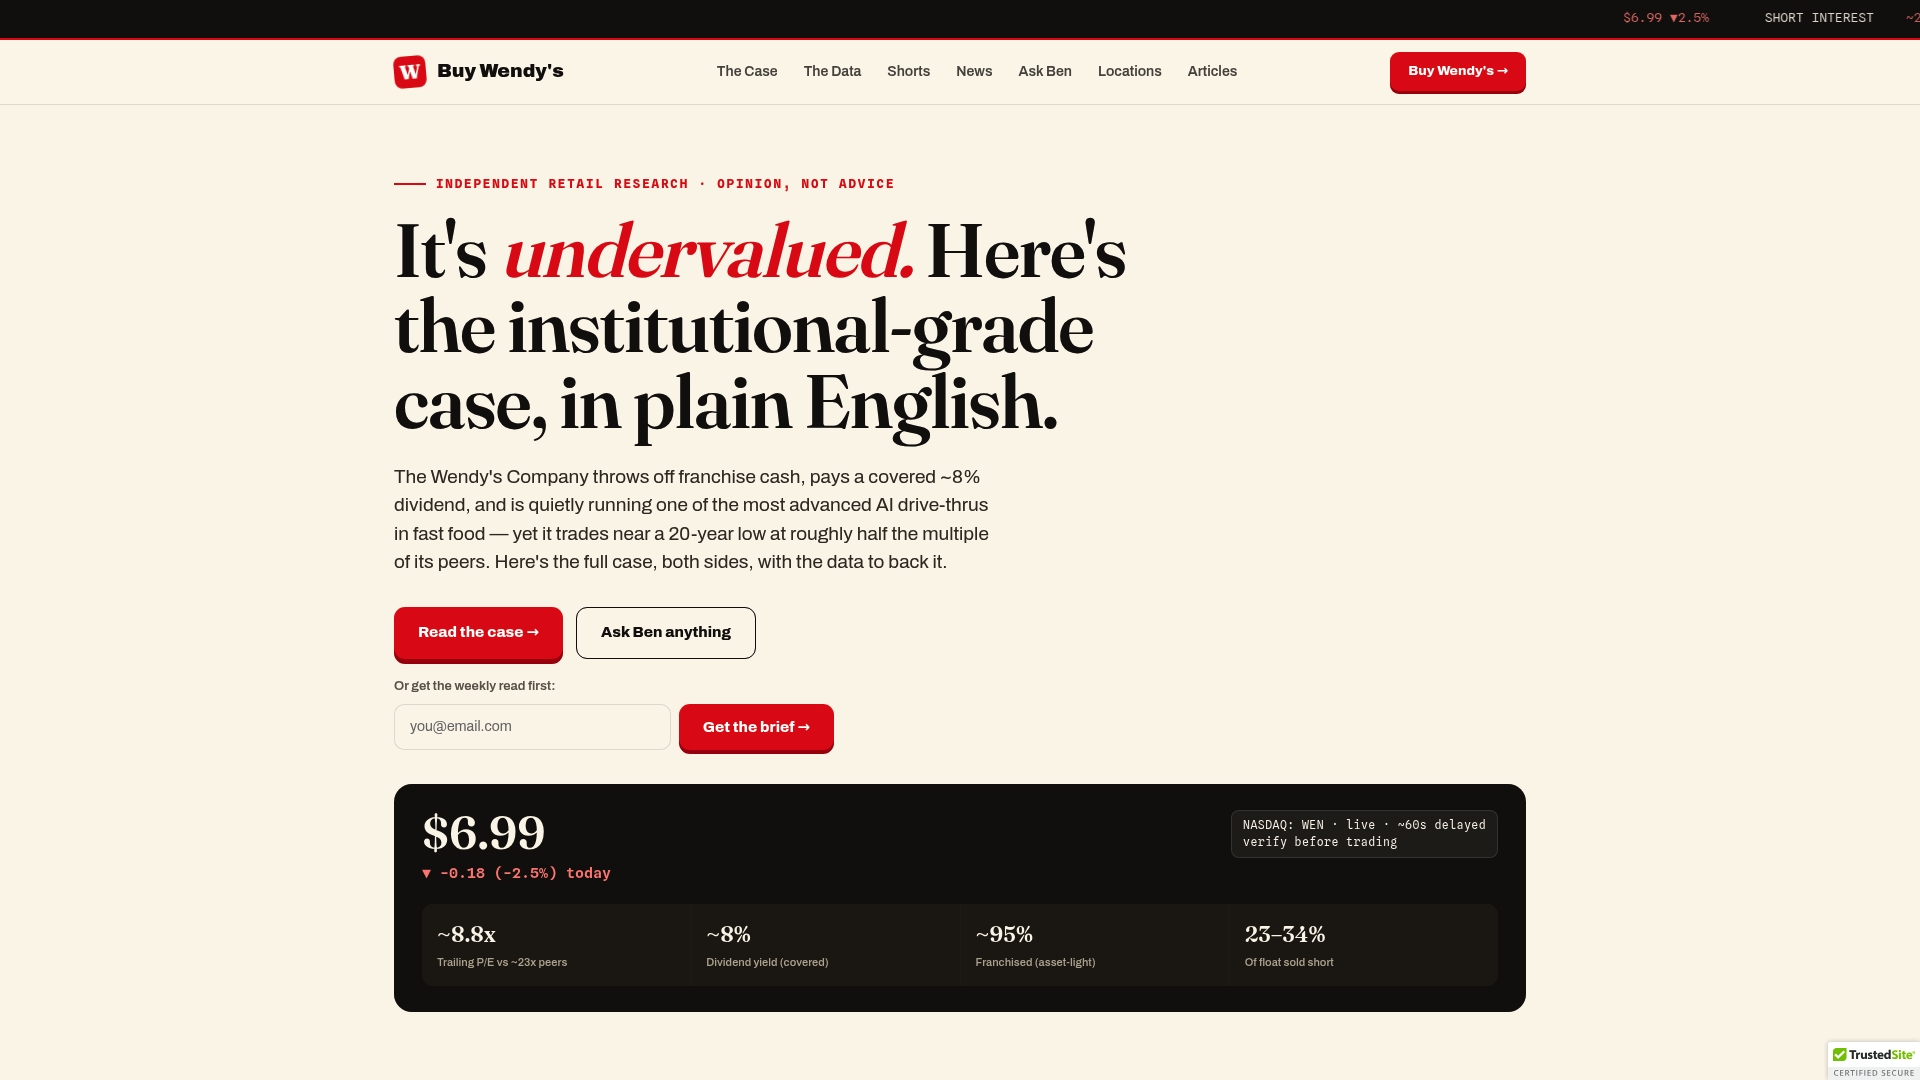
Most restaurant dividend analysis treats Wendy’s as a line item in a sector screen. Buywendys goes deeper: the platform provides dedicated, regularly updated analysis of WEN’s franchise economics, FCF trajectory, FreshAI deployment progress, and dividend sustainability metrics that generalist financial sites do not model at this level of specificity.
For income investors who have identified WEN as a high-yield candidate and want to size the position correctly, Buywendys’s Wendy’s stock bull vs. bear case analysis lays out the scenarios that determine whether the ~5.5% yield is a durable income source or a yield trap. The analysis covers payout-ratio stress tests, franchisee health indicators, and the operational impact of FreshAI on unit economics. Readers who want the underlying data tools can access the best platform for Wendy’s stock data guide for a comparison of data sources and monitoring workflows.
The case for franchisor-first dividend investing: an editorial perspective
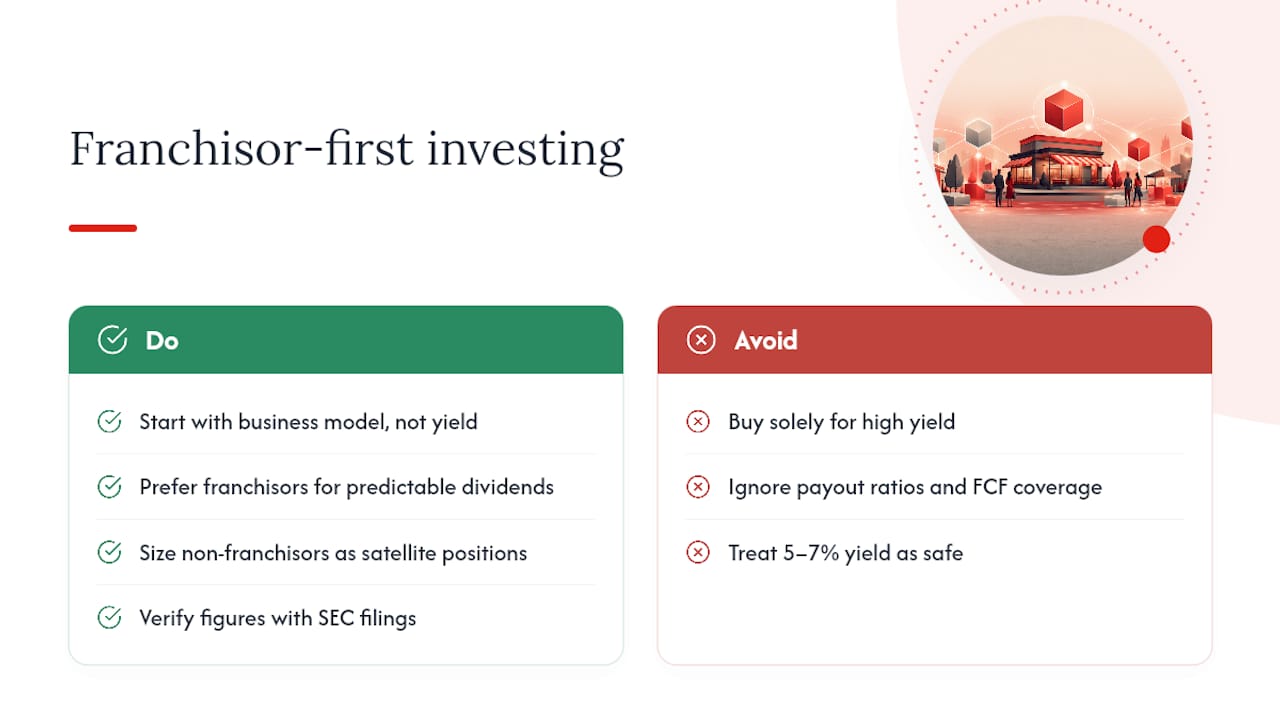
The conventional advice on restaurant dividend stocks is to screen for yield and buy the highest number. That approach consistently leads investors into the same trap: a 5–7% yield that looks attractive until a value-war quarter compresses earnings and the payout ratio spikes above 90%.
The more defensible framework is to start with business model, not yield. A franchisor collecting royalties and rent from thousands of independently operated units is structurally closer to a real estate investment trust than to a traditional restaurant company. The cash flow is contractual, the capex is minimal, and the earnings are not directly exposed to the cost of a single burger patty. McDonald’s 49-year dividend-raise record is not an accident of management discipline; it is the output of a business model that was engineered to produce predictable cash flows regardless of commodity cycles.
Where this framework gets complicated is with names like Wendy’s, where the franchise structure is sound but the payout ratio leaves little margin for error. The high yield is real, and the FreshAI operational catalyst is genuinely interesting from a franchisee-economics perspective. But investors who buy WEN purely for the yield without modeling the FCF coverage are taking on more risk than the yield premium compensates for. The right approach is to treat WEN as a satellite position sized relative to your conviction in the turnaround thesis, not as a core income holding.
The broader point is that restaurant dividend investing rewards investors who understand the difference between a royalty-income business and a restaurant business. Most of the names on this list are the former. The ones that are not require a different analytical lens and a tighter position size.
This article is for general informational purposes only and does not constitute investment or financial advice. Dividend yields, payout ratios, and financial metrics change frequently. Verify all figures with current SEC filings and company investor-relations disclosures, and consult a qualified financial advisor before making investment decisions.
This article is general information, not a substitute for advice from a qualified financial advisor. Consult a qualified financial professional about your own circumstances before acting on anything here.
Sources
The figures and rankings in this article draw on the following primary sources. Verify current yields and payout ratios directly before acting, as dividend metrics change with each earnings report.
- Best Fast-Food Stocks for 2026 and How to Invest | The Motley Fool
- 10 Best Restaurant Dividend Stocks to Buy | Yahoo Finance
- Dividend
- StockAnalysis — QSR stock page
- Best Restaurant Stocks to Buy Now (2026) – Top Restaurant Stocks | WallStreetZen
- 7 Best Restaurant Dividend Stocks to Buy – Insider Monkey