
Table of Contents
- Executive Summary: What You Need to Know About Wendy’s Stock Valuation
- Current Stock Price and Financial Performance
- WEN Price-to-Earnings Ratio and Valuation Metrics
- Wendy’s Franchise Business Model: Impact on Profitability
- Wendy’s Digital Sales Strategy and Technology Growth
- Financial Strength: Cash Flow, Liquidity, and Dividend Sustainability
- Key Risks and the Value Trap Question
- Key Takeaways
Last Updated: August 9, 2026
Executive Summary: What You Need to Know About Wendy’s Stock Valuation
The fundamental analysis of Wendy’s stock requires understanding how the company’s asset-light franchise model, digital transformation initiatives, and dividend sustainability interact to create investment value. Wendy’s operates as a predominantly franchised quick-service restaurant chain where the parent company collects royalties and rent rather than running individual locations. This structure affects profitability metrics, cash flow characteristics, and risk profile differently than traditional restaurant operators. The key to evaluating whether WEN stock represents undervaluation or a value trap lies in analyzing the company’s price-to-earnings ratio against growth prospects, assessing the sustainability of its dividend payout, and measuring the real financial impact of its AI-driven drive-thru technology rollout. Wendy’s Stock & Investor Insights provides detailed analysis of these fundamental factors to help individual investors form independent views on the stock’s valuation.
Current Stock Price and Financial Performance
Wendy’s financial performance reflects the ongoing tension between mature domestic operations and growth initiatives in digital channels and international expansion. The company reports same-store sales trends quarterly, which measure comparable restaurant performance across the franchise base. These figures signal whether franchisees are generating stronger customer traffic and higher average checks, the foundational drivers of royalty and rent revenue flowing to the parent company.
The stock’s year-to-date performance should be evaluated against both the broader restaurant sector and the S&P 500. Relative strength matters because it indicates whether the market is rotating into or out of quick-service restaurant exposure. When discretionary spending slows, consumers often trade down to value-oriented chains, which can benefit Wendy’s positioning.
Market capitalization reflects the total equity value assigned to Wendy’s by public market participants. For a franchise-based model, market cap should be compared to enterprise value (which includes debt) to understand the capital structure. A company trading at a lower market cap relative to its cash generation capacity may represent undervaluation, but only if the balance sheet strength supports the dividend and capital structure is sustainable.
WEN Price-to-Earnings Ratio and Valuation Metrics
The price-to-earnings ratio is the most commonly used valuation metric for quick-service restaurant stocks, but it requires context to be meaningful. A low P/E ratio alone does not indicate undervaluation; it may reflect legitimate concerns about earnings quality, growth prospects, or balance sheet risk.
Wendy’s P/E ratio should be benchmarked against historical trading ranges and against peers in the restaurant sector. If the stock trades at a discount to its five-year average P/E, that could signal either a buying opportunity or a warning that the market has repriced expectations downward for structural reasons.
Normalized earnings matter more than reported earnings for restaurant companies because one-time items and restructuring charges can obscure true operating performance. Focus on earnings before interest, taxes, depreciation, and amortization relative to the cash the business actually generates.
Forward-looking valuation requires estimating future earnings growth. If Wendy’s is expected to grow earnings at a rate comparable to or better than the broader market, a modest P/E premium is justified. If growth is decelerating, the multiple should compress.
Discounted cash flow analysis provides a more rigorous valuation framework than P/E multiples alone. By projecting future free cash flow and discounting it to present value, investors can estimate an intrinsic value range. This method requires assumptions about terminal growth rates and discount rates, but it forces you to articulate what growth and profitability you’re actually pricing into the stock.
Wendy’s Franchise Business Model: Impact on Profitability
The franchise model is fundamental to understanding Wendy’s profitability structure and risk profile. Unlike company-operated restaurants, franchised locations are owned and operated by independent business owners who pay the parent company a percentage of sales (royalty) plus rent. This arrangement dramatically changes how earnings are generated and what drives shareholder returns.
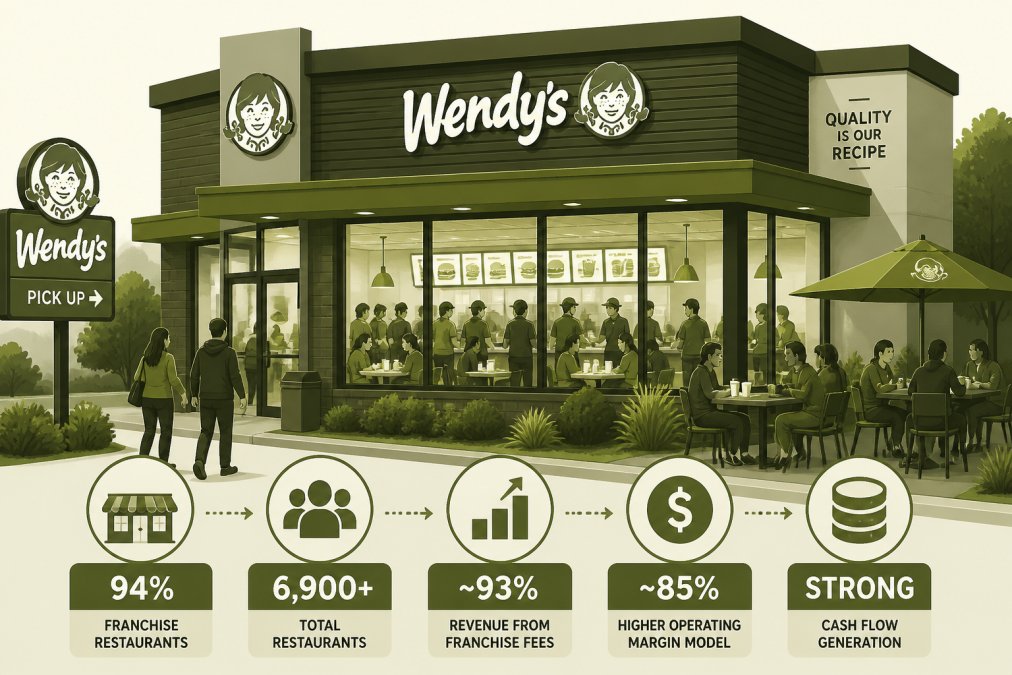
The vast majority of Wendy’s restaurants are franchised, which creates significant advantages. The company avoids the capital intensity of building and maintaining thousands of locations. Franchisees shoulder the investment burden and operational risk. Wendy’s collects high-margin royalty and rent revenue with minimal incremental cost, generating strong cash flow and return on capital compared to traditional restaurant operators.
However, Wendy’s profitability depends entirely on franchisee health. If franchisees face margin pressure from labor inflation, food cost spikes, or declining customer traffic, they cannot simply raise prices without losing competitive position. When franchisee unit economics deteriorate, they may reduce store hours, defer maintenance, or close locations, directly reducing royalty and rent revenue.
Operating margins are relatively high because most costs are variable and scale with franchisee sales. But this also means margins are vulnerable to same-store sales declines. A 5% drop in franchisee sales translates to a roughly 5% drop in Wendy’s revenue, with an even sharper impact on operating income.
Capital expenditure for Wendy’s is primarily directed toward technology infrastructure and support for franchisee digital adoption rather than new restaurant construction. This keeps capex as a modest percentage of revenue, but growth is limited by franchisee willingness to invest in existing locations.
Wendy’s Digital Sales Strategy and Technology Growth
Digital ordering, delivery integration, and AI-powered drive-thru technology represent the most significant operational transformation in Wendy’s recent history. These initiatives directly impact franchisee profitability and, by extension, Wendy’s royalty revenue.
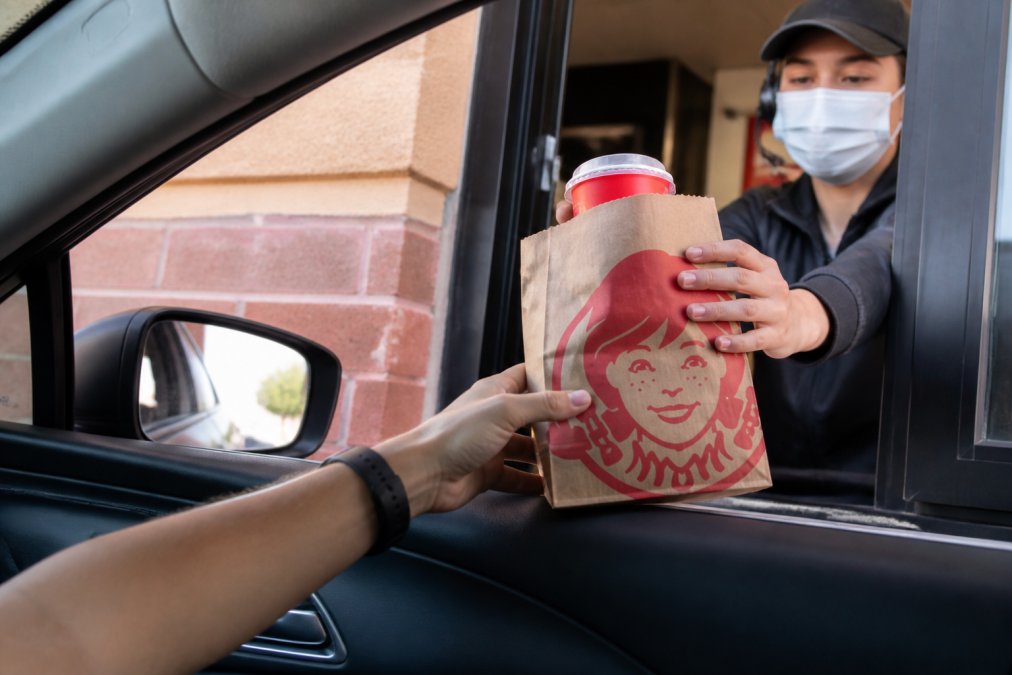
Digital sales penetration measures the percentage of orders placed through digital channels (mobile app, website, third-party delivery platforms) rather than traditional in-store or drive-thru counters. As digital penetration increases, franchisees capture higher-margin orders because digital channels reduce cash handling costs and drive faster throughput during peak hours.
The company’s FreshAI drive-thru technology represents an attempt to address labor constraints and improve order accuracy through AI-assisted ordering. By automating voice recognition and order confirmation at the drive-thru window, the system reduces reliance on human staff during peak hours and potentially increases throughput. If successful, this technology could improve franchisee unit economics and make store operations more resilient to labor market tightness.
Technology adoption requires franchisee investment and training. Not all franchisees have equal access to capital or technical sophistication to implement these systems effectively. Wendy’s must balance pushing technology adoption against franchisee financial capacity.
The financial impact of digital strategy on earnings is real but difficult to quantify precisely. Digital orders typically have higher average check values and lower delivery costs than third-party platforms, but they also cannibalize some traditional in-store traffic. Monitor digital sales penetration and franchisee margin trends as proxies for technology impact. Wendy’s News & Restaurant Tracker provides ongoing updates on digital adoption rates and franchisee performance metrics across the system.
Financial Strength: Cash Flow, Liquidity, and Dividend Sustainability
The dividend is often the primary reason retail investors buy mature restaurant stocks. Understanding whether Wendy’s dividend is sustainable requires analyzing cash flow generation, debt levels, and the company’s capital allocation priorities.
Free cash flow is the cash generated from operations minus capital expenditures. For Wendy’s, free cash flow should be strong because the franchise model generates high-margin revenue with modest reinvestment requirements. A company can sustain dividends only if free cash flow exceeds dividend payments over a multi-year period.
The quick ratio measures liquid assets divided by current liabilities and indicates whether the company can meet short-term obligations. A quick ratio above 1.0 suggests adequate liquidity. For a stable, mature business like Wendy’s, a ratio in the range of 1.0 to 1.5 is typical and healthy.
Debt-to-equity ratio reveals how much the company relies on borrowed funds relative to shareholder equity. Higher leverage amplifies returns in good times but increases financial risk in downturns. Wendy’s debt levels should be evaluated against its peer group and historical norms.
The dividend payout ratio, annual dividends divided by net income, shows what percentage of earnings the company returns to shareholders. A payout ratio above 80-90% leaves little room for earnings volatility. A ratio below 60% suggests the dividend has substantial safety margin.
Return on assets measures how efficiently the company converts total assets into profit. For a franchise model, return on assets should be relatively high because the asset base is smaller than for company-operated chains. A declining return on assets signals that either profitability is weakening or the company is accumulating unproductive assets.
Key Risks and the Value Trap Question
The most important question for value investors is whether Wendy’s represents genuine undervaluation or a value trap, a stock that appears cheap because the market has correctly identified structural deterioration that will persist.
Operational restructuring by the company may signal either turnaround potential or admission that the core business is under pressure. The key is whether restructuring costs are one-time and whether post-restructuring profitability improves.
Declining sales trends are the most serious warning sign for a restaurant operator. If same-store sales have contracted for multiple consecutive quarters, the market is signaling that customer traffic or average check size is eroding. Persistent declines suggest structural problems rather than temporary headwinds.
Supply chain and inflationary pressures affect all restaurant operators, but they hit franchisees harder because they have less pricing power and less scale to negotiate supplier contracts. If commodity inflation or labor costs are rising faster than franchisees can pass through to customers, unit economics deteriorate and royalty growth slows.
Competitive benchmarking reveals whether Wendy’s is gaining or losing share relative to peers. If comparable chains are growing same-store sales while Wendy’s contracts, that suggests company-specific problems rather than industry-wide headwinds.
The dividend sustainability question is critical for income-focused investors. If the company is paying dividends while free cash flow is declining, the payout ratio will eventually become unsustainable. Watch for signals that the board is considering a dividend cut.
Stock volatility and short interest deserve attention. High volatility suggests the market is uncertain about the company’s future, creating opportunity for contrarian investors but also increasing downside risk. Elevated short interest indicates bearish sentiment from sophisticated traders, signaling that the investment thesis faces serious skeptical scrutiny.
Key Takeaways
The fundamental analysis of Wendy’s stock requires integrating multiple financial metrics, operational trends, and strategic positioning into a coherent investment thesis. The franchise model creates structural advantages in cash generation and return on capital, but it also creates vulnerability to franchisee financial stress and same-store sales weakness. The company’s digital transformation initiatives and AI drive-thru technology represent genuine strategic progress, but their financial impact depends on execution and franchisee adoption rates.
Valuation metrics like the price-to-earnings ratio and dividend yield should be evaluated against historical ranges and peer comparisons, not in isolation. A low P/E ratio is only attractive if the market has overestimated the magnitude of structural headwinds. The dividend yield is only safe if free cash flow comfortably covers the payout and is growing over time.
The critical distinction between undervaluation and a value trap lies in whether management can stabilize and grow profitability from current levels. If same-store sales are stabilizing, digital penetration is accelerating, and franchisee unit economics are improving, the stock may represent genuine opportunity at a depressed valuation. If sales continue to decline and margin pressure persists, the stock is likely a value trap regardless of how cheap it appears on traditional metrics.
Individual investors should form independent views on these fundamental factors rather than relying solely on analyst ratings or consensus estimates. The Wendy’s stock thesis ultimately depends on your assessment of whether the company’s franchise base is fundamentally healthy and whether digital and technology initiatives can drive meaningful earnings growth from current levels.
Frequently Asked Questions
What is the primary driver of Wendy’s profitability?
Wendy’s profitability is driven by royalty and rent revenue collected from franchisees. Because the company operates an asset-light franchise model, it generates high-margin cash flow with minimal capital requirements. Franchisee same-store sales growth directly translates to higher royalty revenue.
How does Wendy’s dividend compare to other restaurant stocks?
Wendy’s dividend yield should be compared to peers in the quick-service restaurant sector and to the broader market. A higher yield may attract income investors, but it’s only sustainable if free cash flow growth supports the payout. Check the dividend payout ratio and free cash flow trends to assess safety.
Is the AI drive-thru technology a material earnings driver?
FreshAI and other digital initiatives improve franchisee unit economics by reducing labor costs and increasing throughput. However, the financial impact is difficult to quantify precisely because it depends on franchisee adoption rates and competitive responses. Monitor digital sales penetration and franchisee margin trends as proxies for technology impact.
What would make Wendy’s stock a clear buy or sell?
A clear buy signal would be stabilizing or accelerating same-store sales combined with expanding margins and growing free cash flow. A clear sell signal would be persistent same-store sales declines combined with declining margins and a dividend payout ratio approaching unsustainable levels.
How should I evaluate whether WEN is undervalued or a value trap?
Compare the current price-to-earnings ratio to historical averages and to peers. Analyze same-store sales trends over the past 8-12 quarters. Review free cash flow generation and dividend coverage. If valuation is depressed but fundamentals are stabilizing, it may be undervalued. If valuation is depressed because sales are declining, it’s likely a value trap.
Where can I find detailed Wendy’s financial data and analysis?
Official SEC filings (10-K and 10-Q reports) contain comprehensive financial statements and management discussion. Wendy’s Stock & Investor Insights provides independent analysis of WEN stock valuation and franchise fundamentals specifically for individual investors seeking institutional-quality research without the cost of professional advisory services.
Frequently Asked Questions
Is Wendy's stock undervalued at current price levels?
Whether WEN stock is undervalued depends on your valuation model and time horizon. Fundamental analysis of Wendy's stock requires comparing its price-to-earnings ratio, dividend yield, and cash flow generation against historical averages and peer benchmarks. The company's franchise-heavy business model produces consistent cash flow, but earnings pressure from labor costs and competitive pressures warrant careful analysis. Investors should build their own base case valuation using discounted cash flow or comparable company analysis rather than relying on single metrics.
How does the WEN price-to-earnings ratio compare to other fast-food chains?
The WEN price-to-earnings ratio is a key valuation metric for comparing Wendy's to competitors. A lower P/E relative to industry peers may suggest undervaluation, but it can also signal market concerns about future earnings growth. Factors affecting Wendy's P/E include operational restructuring efforts, franchise royalty stability, and digital sales contribution. Always compare P/E multiples alongside return on assets, profitability margins, and revenue growth rates to form a complete picture of relative value.
What makes Wendy's franchise business model different from company-operated chains?
Wendy's franchise business model generates royalty revenue with lower capital expenditure than company-operated restaurants. Franchisees bear the operational risk while Wendy's collects rent and royalties, creating more stable cash flow. This structure affects shareholder equity and debt-to-equity ratios differently than vertically integrated competitors. However, franchisee profitability directly impacts royalty growth, so investor returns depend on franchise unit economics and system-wide sales performance.
How does Wendy's digital sales strategy impact stock valuation?
Wendy's digital sales strategy, including mobile ordering and AI-driven drive-thru technology, influences revenue growth and operational efficiency metrics used in fundamental analysis of Wendy's stock. Higher digital penetration typically improves throughput, reduces labor costs per transaction, and increases customer data for personalization. These factors support profitability margins and justify higher valuation multiples. Track digital sales as a percentage of total revenue to gauge management execution and competitive positioning.
This article was written using GrandRanker