
For a multi-unit franchised chain focused on standardized operations and centralized reporting, a restaurant-specialist point-of-sale system fits better than a platform-agnostic provider. For Wendy’s specifically, the Toast vs Square decision is not primarily about processing fees — it is about whether the POS architecture can support FreshAI telemetry, cross-unit analytics, and franchisee rollout economics at scale.
TL;DR:
- Toast offers deeper native restaurant features (KDS, inventory, centralized menu management) but carries higher CAPEX, proprietary hardware lock-in, and longer contract commitments.
- Square offers lower upfront cost, published pricing, and no long-term contract, but relies more heavily on third-party integrations to reach operational parity for high-volume restaurant workflows.
- For Wendy’s investors, the key variable is not which system is cheaper per unit — it is whether the chosen architecture enables the centralized data capture that makes FreshAI economically viable at scale.
Table of Contents
- How do Toast and Square compare for franchise investors?
- How do Toast and Square differ in hardware, software, and back-of-house features?
- What does the TCO look like for a single franchise unit?
- What do these differences mean for Wendy’s strategy and FreshAI?
- What operational and financial risks should investors track?
- What questions and KPIs should analysts ask management?
- What is the baseline recommendation, and what would change it?
- Key Takeaways
- The POS decision is more consequential than most analysts price in
- Buywendys research analysts should read next
- Useful sources for further research
How do Toast and Square compare for franchise investors?
| Dimension | Toast | Square |
|---|---|---|
| Hardware model | Proprietary Android hardware; quoted bundle pricing; required for full functionality | iPad and Square Terminal supported; published device prices ($59 Reader to $899 Register) |
| Native restaurant features | Built-in KDS, course firing, inventory, payroll, scheduling, centralized menu management | KDS and ingredient-level inventory via third-party integrations (e.g., MarketMan) |
| Integration dependency | Lower for core restaurant workflows; higher for non-restaurant add-ons | Higher — parity with Toast’s native features requires a third-party stack |
| TCO shape | Higher upfront CAPEX; $0 entry path tied to elevated processing rates under 1–2 year commitment | Lower upfront; higher per-transaction rate on free tier; costs rise with integration stack |
| Scalability for rollouts | Purpose-built for multi-unit chains; centralized menu and reporting tools | Faster single-unit setup; multi-unit management less native |
| Data ownership & analytics | Centralized reporting; better suited for enterprise telemetry and AI integration | Data accessible but enterprise analytics require additional configuration |
| Contract terms | Often 1–2 year processing commitment tied to hardware path | Month-to-month; no long-term contract is a core differentiator |
| Support | Dedicated restaurant support; 24/7 options on higher tiers | General business support; restaurant-specific depth is shallower |
- Hardware lock-in is the single largest switching-cost driver for Toast; depreciation schedules on proprietary devices should be modeled separately from software fees.
- Integration stack costs for Square can close the gap with Toast’s native features but add recurring third-party subscription expenses that are often underestimated at the unit level.
- Contract length directly affects NPV: a 2-year processing commitment on Toast’s $0 hardware path can cost more in aggregate than purchasing hardware outright at a lower processing rate.
Pro Tip: When building a franchise rollout model, the single metric that most often flips an NPV calculation is the combination of contract length and hardware depreciation period. A 2-year processing commitment with a 3-year hardware life creates a mismatch that inflates effective annual cost.
How do Toast and Square differ in hardware, software, and back-of-house features?
The core operational distinction is straightforward: Toast is a restaurant-specialist system built on proprietary Android hardware that is required for full functionality, while Square is a platform-agnostic provider that supports iPads and its own Terminal devices with published pricing.
Hardware and software differences:
- Toast enforces restaurant-grade proprietary hardware; device pricing is typically disclosed by quote rather than published publicly.
- Square publishes device prices ranging from $59 for the Reader to $899 for the Register, and supports BYOD (bring-your-own-device) iPad configurations.
- Toast’s built-in KDS and course-management are core features, not add-ons; Square sells KDS and ingredient-level inventory primarily through third-party integrations.
- Toast includes payroll, scheduling, and centralized menu management natively; Square requires additional subscriptions for comparable depth.
Back-of-house is where the gap widens most for high-volume operators. Toast’s kitchen display system handles course firing and ticket routing without a third-party layer, which reduces failure points in a busy drive-thru or dual-lane kitchen. Square’s reliance on integrations like MarketMan for inventory creates an additional vendor dependency that adds both cost and potential downtime risk. For a franchise system running hundreds of units, each additional integration point is a multiplication of support complexity.
The logical flow of a Toast installation runs from front-of-house handheld devices and terminals through a native KDS to cloud-based centralized reporting. Square’s architecture is more modular: the terminal handles payments, but kitchen and inventory functions route through third-party APIs. That modularity is an advantage for a single-location café; for a franchised chain, it is a coordination liability.

Pro Tip: Ask franchisees specifically about daily failure modes and spare-device policies. A proprietary hardware system with no local spare inventory can mean hours of downtime waiting for a vendor replacement; Square’s iPad compatibility means a franchisee can walk into an Apple Store for a same-day fix.
What does the TCO look like for a single franchise unit?
The structural TCO difference between Toast and Square arises from three variables: contract terms, hardware ownership model, and the cost of the third-party integration stack needed to reach operational parity.
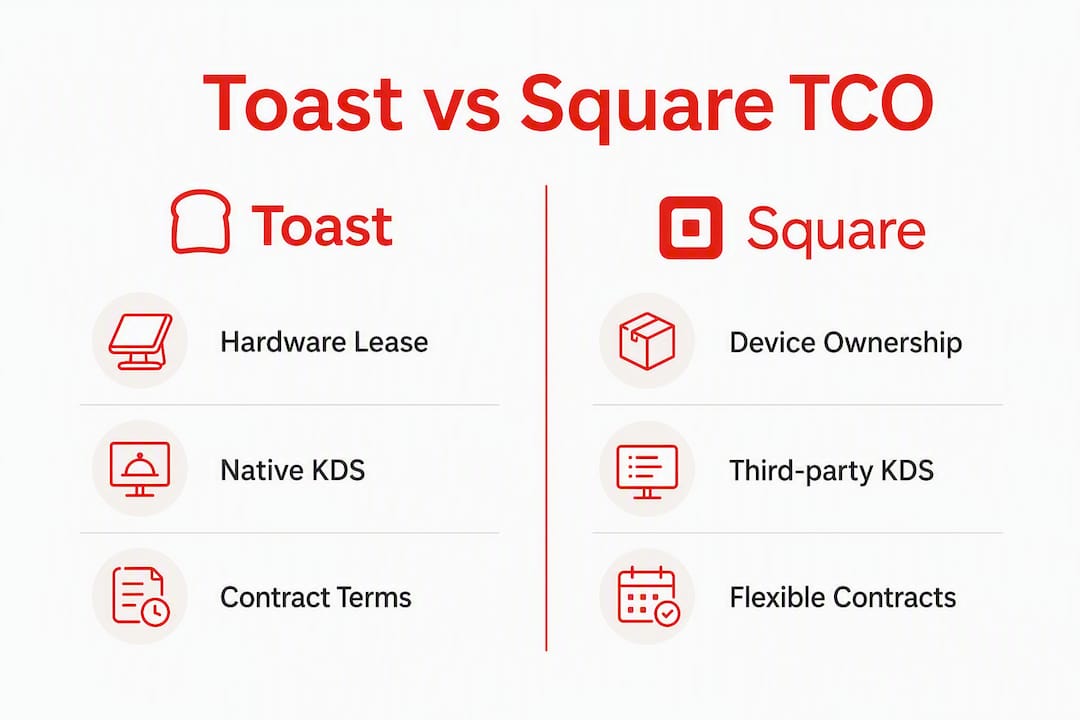
| Cost Component | Toast (Quoted Path) | Square (Published Path) |
|---|---|---|
| Upfront hardware | Quoted bundle pricing, details not publicly disclosed | Published device prices range from entry-level to premium options |
| Monthly software fee | Varies by tier; starter plans available | Free tier available; paid plans add features |
| Processing rate | Similar magnitude on comparable paid tiers; $0 entry path tied to elevated processing rates under long-term commitment | Higher on free tier; declines by plan tier |
| Third-party integrations | Lower need for core restaurant functions | $50–$200+/month for KDS and inventory parity |
| Hardware depreciation | Typically modeled over hardware lifespan; exact schedules may vary | |
| 3-year cumulative cost (est.) | Higher upfront, potentially lower processing cost | Lower upfront, higher integration stack over time |
Key sensitivities for analysts:
- A high-volume unit (1,000+ transactions/day) benefits more from Toast’s lower processing rate on the paid hardware path; the CAPEX is recovered faster through fee savings.
- A lower-volume unit may never recover Toast’s hardware premium, making Square’s lower-upfront model more favorable on a 3-year NPV basis.
- Processing rates between the two platforms are similar in magnitude on comparable paid tiers — the real divergence is in software tier pricing, hardware costs, and add-on fees.
- Toast’s $0 entry path is tied to higher processing rates under a long-term commitment; Square’s free tier carries higher per-transaction rates that decline as plan tier rises.
For a franchise system like Wendy’s, the relevant model input is not the single-unit TCO but the systemwide CAPEX request. Multiply the per-unit hardware delta across hundreds of franchise locations, and the choice of vendor becomes a balance-sheet event, not just an operational preference.
What do these differences mean for Wendy’s strategy and FreshAI?
For Wendy’s, the POS vendor decision centers on a specific strategic tradeoff: centralized standardization and data capture versus franchisee-level flexibility and lower adoption friction. That tradeoff has direct implications for FreshAI and for the company’s ability to scale AI-driven operations across its approximately 7,000-unit system.
A centralized, restaurant-specialist POS enables standardized loyalty programs, consistent cross-unit reporting, and uniform telemetry collection — all of which feed FreshAI’s predictive analytics. A heterogeneous stack, where different franchisees run different systems or integration configurations, complicates enterprise analytics and increases the cost of maintaining consistent AI inputs.
Investor signals to monitor:
- Management language referencing “centralized POS adoption rates” or “systemwide technology standards” signals a push toward standardization.
- Disclosure of a preferred vendor agreement or technology fee embedded in franchise agreements would indicate corporate-level commitment.
- FreshAI pilot results reported by region — if telemetry is inconsistent across regions, that may reflect POS heterogeneity rather than AI model failure.
- Franchisee CAPEX requests rising in technology line items on franchise disclosure documents (FDD Item 7) would indicate a hardware-heavy rollout.
The franchisee economics matter here. A centralized POS mandate from Wendy’s corporate reduces franchisee negotiating leverage and increases their upfront technology investment. That can slow adoption, particularly among smaller franchisee groups. Phased rollouts with corporate co-investment or technology fee subsidies would reduce friction but compress near-term free cash flow.
What operational and financial risks should investors track?
Vendor lock-in, underestimated integration stack costs, franchisee resistance, and analytics gaps are the primary risks if Wendy’s announces a large-scale POS rollout or vendor change.
Red flags to monitor:
- Unusual increases in franchisee CAPEX requests in FDD Item 7 disclosures, particularly in technology and equipment line items.
- Contract amendments disclosing higher or renegotiated processing rates across the franchise system.
- Elevated chargeback costs or payment processing disputes, which can signal integration failures between POS and payment processors.
- KDS uptime metrics below acceptable thresholds, which directly affect order accuracy and throughput in drive-thru operations.
- Inconsistent FreshAI telemetry across pilot regions, which may indicate POS data feeds are not standardized.
- Franchisee opt-out rates from a technology mandate, measurable through unit count disclosures in quarterly filings.
Red Flag: A multi-year processing commitment tied to proprietary hardware is the single most consequential risk in a large franchise rollout. It increases switching costs, extends hardware depreciation exposure, and reduces franchisee flexibility — all of which can suppress unit-level returns and create franchisee relations friction that slows systemwide adoption.
What questions and KPIs should analysts ask management?
| Operational Dimension | KPI to Request | Sample Question for Management |
|---|---|---|
| POS adoption | % of company and franchise units on centralized POS | “What percent of units currently run the standardized POS platform?” |
| Franchisee CAPEX | Average technology CAPEX per unit for rollout | “What is the average per-unit hardware and software investment required for the current rollout?” |
| Processing rates | Blended processing rate range across the system | “What is the range of merchant processing rates across company and franchise units?” |
| FreshAI integration | Data ownership and telemetry feed structure | “Who owns the raw telemetry data from FreshAI, and how is it integrated with the POS layer?” |
| Hardware reliability | Device replacement rate and mean time to repair | “What is the average device replacement rate annually, and what is the spare-device policy?” |
| KDS uptime | KDS uptime percentage across pilot locations | “What KDS uptime metrics are you tracking in FreshAI pilot regions?” |
| Online ordering margin | Incremental margin from commission-free online ordering | “What is the incremental margin contribution from direct online ordering versus third-party delivery?” |
Translating answers into model scenarios:
- Base case: Assume gradual centralized adoption over 3–4 years, with franchisee CAPEX subsidized partially by corporate. Model processing rates at the midpoint of disclosed ranges.
- Bullish case: Rapid adoption driven by FreshAI telemetry benefits, with corporate co-investment reducing franchisee friction. Higher uptime and order accuracy improve throughput and ticket size.
- Bearish case: Franchisee resistance slows adoption; integration costs exceed initial estimates; FreshAI telemetry gaps reduce AI model accuracy and delay ROI.
For deeper context on converting these inputs into restaurant stock valuation metrics, the framework matters as much as the individual data points.
What is the baseline recommendation, and what would change it?
The baseline modeling stance for Wendy’s is to assume centralized standardization benefits from a restaurant-specialist POS architecture, but to stress-test franchisee CAPEX and adoption friction as the primary downside variables. A specialized system’s native KDS, centralized reporting, and FreshAI telemetry compatibility justify the higher upfront cost at the system level — provided adoption rates are sufficient to amortize that investment across enough units.
Flip signals that would change this view:
- Vendor contract disclosures showing unfavorable long-term processing rates that materially compress unit-level margins.
- Broad franchisee resistance, measurable through opt-out rates or FDD Item 7 CAPEX ranges rising faster than revenue.
- FreshAI telemetry failing to integrate consistently with the POS layer, undermining the core strategic rationale for centralization.
- A shift in Wendy’s corporate strategy toward asset-light, franchisee-choice technology models that prioritize adoption speed over standardization.
- Hardware replacement costs exceeding depreciation schedules, creating unplanned CAPEX demands at the franchise level.
Key Takeaways
For Wendy’s investors, the Toast vs Square decision is a franchise economics question first and a technology question second — contract structure and hardware ownership drive long-term TCO more than headline processing fees.
| Point | Details |
|---|---|
| Operational fit drives the choice | Toast fits multi-unit, high-volume chains; Square fits lower-volume or mixed-retail operators with simpler workflows. |
| TCO is structural, not just transactional | Contract length, hardware ownership, and integration stack costs determine 3-year NPV more than processing rate differences. |
| FreshAI depends on POS standardization | Centralized POS architecture is a prerequisite for consistent FreshAI telemetry and cross-unit AI analytics at scale. |
| Franchisee CAPEX is the key risk variable | A systemwide hardware mandate multiplies per-unit costs across hundreds of locations, making adoption friction a balance-sheet event. |
| Buywendys provides the modeling framework | Buywendys covers FreshAI economics, franchise unit economics, and TCO scenarios for analysts building Wendy’s investment models. |
The POS decision is more consequential than most analysts price in
The conventional framing of the Toast vs Square debate focuses on features and fees. That framing misses the more important question for a franchised chain: what does the POS architecture enable or prevent at the enterprise level?
Wendy’s is not choosing a cash register. It is choosing the data infrastructure that either supports or undermines FreshAI’s ability to learn from systemwide order patterns, staffing inputs, and throughput metrics. A fragmented POS environment — even one that is cheaper per unit — creates analytical noise that degrades AI model performance over time. The cost of that degradation does not show up in a single-unit TCO model. It shows up in the gap between what FreshAI could deliver and what it actually delivers across a heterogeneous system.
The analysts who will model this correctly are the ones who ask management not just about processing rates, but about data ownership, telemetry architecture, and franchisee technology compliance rates. Those are the variables that connect POS vendor choice to long-term earnings power.
Buywendys research analysts should read next
Investors who have worked through the operational comparison above need one more layer: how these POS and FreshAI dynamics translate into a full investment thesis for WEN. Buywendys publishes independent research that connects franchise technology economics directly to stock valuation, covering FreshAI unit economics, TCO scenario modeling, and bull/bear case construction for Wendy’s.
Start with the Wendy’s Stock Bull vs Bear Case for a complete investment stance that incorporates technology rollout scenarios. For analysts who want to build their own models, the FreshAI economics and franchise margin analysis provides the unit-level inputs needed to stress-test adoption assumptions. The AI drive-thru revenue impact analysis covers how POS telemetry integration affects FreshAI performance metrics and what that means for WEN’s long-term earnings trajectory.
Useful sources for further research
- Toast vs Square for Restaurants (2026): Fees & Fit — Chowly: Verify published processing rate ranges, hardware path options, and the structural cost differences between $0 entry and paid hardware paths. Use to validate TCO model assumptions on contract terms.
- Toast vs. Square: A Head-to-Head Comparison — Owner.com: Check KDS and inventory feature depth for each platform. Confirms which back-of-house capabilities are native versus third-party dependent.
- Toast vs Square — TechnologyAdvice: Review published Square device pricing ($59–$899 range) and Toast’s quoted bundle structure. Use to anchor hardware CAPEX estimates in the per-unit model.