
Rising minimum wages at restaurants do not directly compress Wendy’s corporate margins in the way they would for a company-operated chain, but they do create measurable second-order risk through franchisee economics, system-wide price pass-through pressure, and concentrated state-level exposure. Wendy’s franchise-heavy model insulates corporate royalty and rent revenue in the short term, yet California’s AB 1228 sets a fast-food minimum wage well above the federal level and New York’s metro minimum wage is set significantly higher than the federal level, create concentrated unit-level stress that eventually flows upstream.
Three investor actions to prioritize:
- Monitor same-store sales (AUV) trends in California and New York metro markets for early signs of franchisee margin compression.
- Run a $1.00/hour sensitivity on franchisee EBITDA per unit and map the result to royalty revenue at risk.
- Check franchisee commentary on earnings calls for language around royalty deferrals, remodel slowdowns, or assistance programs.
Table of Contents
- How do U.S. minimum-wage rules actually work for restaurant investors?
- Why Wendy’s franchise model changes how wage costs hit the income statement
- A practical sensitivity framework you can copy into your model
- What operational levers do restaurants use, and what signals do they produce?
- What regulatory trends should analysts watch over the next 1–5 years?
- Which signals in Wendy’s filings should you monitor?
- Key Takeaways
- The case for treating wage risk as a system-level, not a line-item, problem
- Buywendys gives you the model, not just the narrative
- Useful sources and further reading
How do U.S. minimum-wage rules actually work for restaurant investors?
The federal minimum wage remains unchanged for many years at a level considered low relative to many states. For most fast-food operators, that number is irrelevant in practice because the majority of high-density markets have set state or local floors well above it.
Two state-level rules carry the most modeling weight for Wendy’s:
- California AB 1228: Effective April 1, 2024, covered fast-food employees must earn at least $20.00/hour. The Fast Food Council can index future increases to CPI or 3.5% annually, whichever is lower, making this a compounding input, not a one-time shock.
- New York region-specific schedule: As of January 1, 2026, the New York minimum wage varies regionally, with higher rates in NYC and surrounding areas, reflecting local policy differences. Hospitality employers may apply a tip credit, reducing the cash wage for food service workers in NYC to $11.35 with a $5.65 tip credit, but fast-food workers generally do not receive tips, so the full $17.00 floor applies.
For modeling, key factors include tip credit applicability, industry specificity of wage floors, indexing method, and geographic unit concentration.
Why Wendy’s franchise model changes how wage costs hit the income statement
Franchisees, not The Wendy’s Company, write the payroll checks. That means a mandated wage increase hits franchisee operating expenses directly, while the corporate P&L registers the effect only indirectly, through changes in average unit volume, royalty receipts, and rent income.
The transmission path works as follows:
- Direct franchisee impact: Higher hourly labor costs compress unit-level EBITDA. If a franchisee cannot offset through pricing or productivity, margins thin and debt service coverage ratios deteriorate.
- Corporate revenue sensitivity: Royalties are typically calculated as a percentage of gross sales. If franchisees raise menu prices to recover labor costs, royalty dollars increase. If they cannot raise prices without losing traffic, AUV stagnates or declines, and royalties follow.
- Company-operated stores: Wendy’s does operate a smaller set of corporate units where wage increases hit the P&L directly as a labor expense line item. Analysts should isolate this exposure when reading segment disclosures.
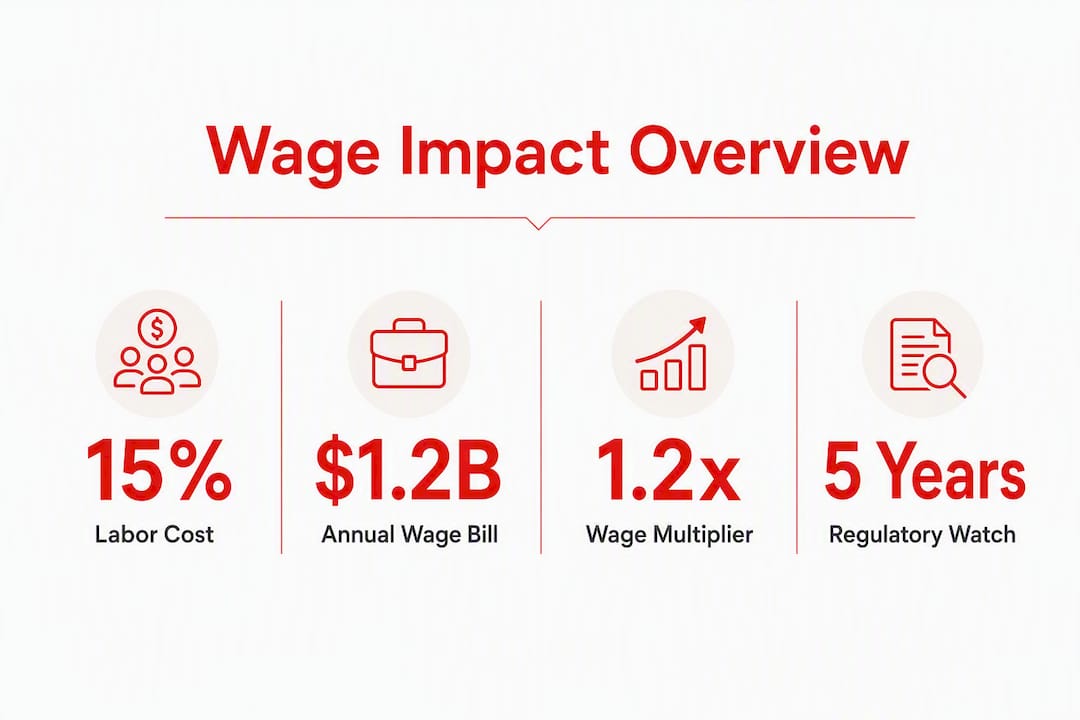
One often-overlooked amplification: when mandated floor wages rise, operators typically must also raise pay for experienced crew and shift supervisors to preserve wage differentials. Research on restaurant labor dynamics suggests this wage ladder effect can multiply the headline payroll increase by 1.1–1.4x, depending on the existing pay structure. A $1.00/hour statutory increase may translate to $1.20–$1.40/hour in total per-employee cost when the full ladder is adjusted.
Pro Tip: When building a franchisee margin model, apply a 1.2x multiplier to the headline wage increase before converting to a percentage-of-sales impact. This accounts for wage ladder compression without requiring granular payroll data.

A practical sensitivity framework you can copy into your model
The core conversion follows two steps. First, translate the hourly rate change into an annual per-unit payroll delta. Second, divide that delta by the unit’s AUV to express the impact as a percentage of sales, then apply that percentage to EBITDA using the unit’s historical labor-to-EBITDA leverage ratio.
Step-by-step formula:
- Annual payroll delta = ($/hour increase) × (average weekly labor hours per unit) × 52 × (wage ladder multiplier, e.g., 1.2)
- Labor % of sales shift = Annual payroll delta ÷ AUV
- EBITDA impact per unit = Labor % shift × (EBITDA / labor leverage ratio)
- System royalty sensitivity = EBITDA impact per unit × franchised unit count × royalty rate × (AUV at risk ÷ AUV)
Key modeling inputs to collect:
| Input | Description |
|---|---|
| AUV | Annual unit volume per location (from FDD or earnings disclosures) |
| Weekly labor hours | Average crew hours per unit per week |
| Current labor % of sales | Baseline from operating margin benchmarks |
| Royalty rate | Percentage of gross sales paid to franchisor |
| Corporate ownership mix | Share of units that are company-operated |
Illustrative sensitivity outcomes (representative unit, not Wendy’s-specific disclosed figures):
| Scenario | Wage floor | $1/hr increase impact (labor % of sales) | Notes |
|---|---|---|---|
| California metro (AB 1228) | $20.00/hr | Higher relative impact | Already above $20; future CPI indexing compounds annually |
| New York City | $17.00/hr | Moderate-to-high impact | No tip credit for fast-food; full floor applies |
| Low-wage state (federal floor) | federal minimum | Lower relative impact | Larger absolute gap to living-wage benchmarks |
The MIT Living Wage benchmarks are useful as a ceiling scenario: operators who voluntarily guarantee living-wage rates absorb higher baseline costs but report retention and applicant-flow benefits that can partially offset payroll increases through lower turnover expense.
What operational levers do restaurants use, and what signals do they produce?
Rising labor costs rank among the largest operating expenses for restaurant operators, forcing tradeoffs that show up in financial disclosures in predictable ways.
The primary mitigation levers, and their investor-facing signals:
- Menu price increases: The most immediate response. Watch same-store sales growth relative to traffic counts. Price-driven comps with flat or declining traffic indicate elasticity stress.
- Labor scheduling and productivity: Reducing hours, shifting to part-time, or restructuring shift coverage. Signals appear in labor-cost disclosures and franchisee commentary.
- Drive-thru automation via FreshAI: Wendy’s has deployed FreshAI at drive-thru lanes as a labor substitution and throughput tool. Track FreshAI deployment cadence and AUV changes post-deployment rather than focusing solely on capex amounts.
- Living-wage fees: Surcharges typically in the 15–22% range, taxed as wages, shift pay volatility from employees to the restaurant’s P&L. They require customer disclosure and carry PR risk, but they stabilize labor cost predictability.
Automation is a capex-intensive lever with a multi-quarter payback horizon. Scheduling optimization and pricing are opex adjustments that take effect within one to two quarters. Analysts should distinguish between these timelines when projecting margin recovery paths.
Pro Tip: When evaluating FreshAI as a wage offset, look for AUV improvement data in the quarters following deployment, not just capex guidance. The demographic and throughput edge is what drives the financial case, not the hardware spend alone.
What regulatory trends should analysts watch over the next 1–5 years?
The direction of food industry wage trends is toward higher floors and more frequent indexing, not stability. Several structural forces drive this:
- CPI and fixed-percent indexing: California’s Fast Food Council can raise the $20.00/hour floor annually. Once indexing is embedded in statute, wage increases become a recurring modeling input rather than a discrete event.
- Municipal ordinances: Cities can set floors above state minimums. Seattle, San Francisco, and similar markets have done so repeatedly, creating a patchwork that requires unit-level geographic analysis.
- Sector-specific statutes: AB 1228 established a precedent for industry-targeted wage floors. Other states with active labor advocacy could adopt similar fast-food-specific rules, bypassing general minimum wage schedules.
- Living-wage advocacy: The growing acceptance of mandatory living-wage fees in urban markets signals that some operators are treating wage floors as a pass-through mechanism rather than a margin headwind.
The asymmetric risk for Wendy’s is unit concentration. A franchisor with a high share of units in California or New York metro faces compounding annual increases in those markets, while units in low-wage states remain near the federal floor. Geographic unit distribution data from the Franchise Disclosure Document is the primary input for quantifying this concentration risk.
Which signals in Wendy’s filings should you monitor?
The following items, tracked across consecutive quarters, provide the earliest visible evidence of wage pressure transmitting through the system:
- Same-store sales by region: Divergence between California/New York and national comps is the clearest early signal.
- AUV trends: Flat or declining AUV in high-wage states, while national AUV holds, points to franchisee pricing constraints.
- Royalty and rent receipts: Sequential deceleration in royalty growth relative to unit count growth indicates AUV pressure.
- Capex guidance for automation: Acceleration in technology capex, particularly for drive-thru AI, signals management’s expectation of sustained wage pressure.
- Franchisee assistance programs: Disclosure of temporary royalty relief, rent deferrals, or remodel timeline extensions are early-warning indicators of franchisee distress.
Red flag language to flag in earnings calls and footnotes: Any combination of “franchisee support,” “temporary relief,” “remodel timeline adjustment,” and “geographic softness” appearing together in the same quarter’s commentary warrants a deeper review of franchisee leverage ratios and store closure trends. Sequential closures in California or New York metro, even at low absolute counts, can signal that the wage floor has exceeded the unit’s pricing power ceiling.
Key Takeaways
Wendy’s franchise model limits direct corporate margin exposure to minimum wage increases, but franchisee economics, AUV trends, and royalty receipts are the transmission channels that matter most for investors.
| Point | Details |
|---|---|
| Federal floor is largely irrelevant | The federal minimum affects few Wendy’s markets; California ($20/hour) and New York ($17/hour) are the operative inputs. |
| Wage ladder multiplier matters | Apply a 1.2x multiplier to headline increases to capture full payroll impact across the wage ladder. |
| Franchise model buffers but does not eliminate risk | Corporate royalties depend on AUV; franchisee margin stress eventually compresses system sales and royalty receipts. |
| FreshAI is a multi-quarter offset | Automation capex takes quarters to show AUV lift; do not model it as an immediate wage offset in near-term scenarios. |
| Buywendys coverage | Buywendys tracks franchisee distress signals, FreshAI deployment data, and AUV trends to help investors model wage transmission. |
The case for treating wage risk as a system-level, not a line-item, problem
The conventional framing of minimum wage risk for restaurant stocks focuses on the labor cost line. That framing misses the more consequential dynamic for a predominantly franchised system like Wendy’s. The real exposure is not what Wendy’s pays its own employees. It is whether franchisees in California and New York can sustain AUVs high enough to keep royalty streams intact, service their debt, and continue investing in remodels and technology.
Analysts who model only the direct corporate labor line will underestimate the second-order effects: slower remodel cadence, reduced franchisee appetite for new unit development, and the gradual erosion of system-wide pricing power if franchisees in high-wage markets push prices above local elasticity thresholds. The bondholder market has historically priced franchisee credit risk before equity analysts have adjusted their models. Watching franchisee debt spreads and covenant disclosures alongside the standard earnings metrics gives a more complete picture of where the system actually stands.
The FreshAI automation story is real, but it is a multi-year offset, not a near-term fix. Investors who treat drive-thru AI as a 2026 margin recovery catalyst are likely ahead of the deployment and payback timeline. The more defensible position is to model wage pressure as a persistent headwind, apply conservative AUV assumptions for California and New York units, and treat automation upside as an option value rather than a base-case input.
Buywendys gives you the model, not just the narrative
Wage sensitivity analysis for Wendy’s requires unit-level AUV data, franchisee margin benchmarks, and a clear view of geographic unit concentration. Buywendys publishes the Wendy’s Stock Fundamental Analysis Report, which includes downloadable modeling templates built around the franchise transmission framework described in this article. The report covers royalty sensitivity, franchisee margin stress scenarios, and FreshAI deployment timelines in a format analysts can drop directly into a DCF or comparable-company model.
If you want a faster entry point, the valuation analysis provides a current-price context that incorporates wage headwinds alongside commodity costs and automation upside. Access the full report and sensitivity templates at Buywendys to run the scenarios outlined here with pre-built inputs.
Useful sources and further reading
Primary government and statutory sources:
- U.S. Department of Labor — Minimum Wage by State: Federal floor and state-by-state comparison table.
- California Department of Industrial Relations — AB 1228 Fast Food Minimum Wage FAQ: Statutory text, coverage definitions, and Fast Food Council indexing rules.
- New York State — Minimum Wage Schedule: Region-specific rates and tip-credit mechanics effective January 1, 2026.
- MIT Living Wage Technical Documentation: Methodology for living-wage benchmarks used in alternative scenario modeling.
- National Restaurant Association — State of the Industry: Industry-level analysis of labor cost pressures and operator responses.
Buywendys modeling and analysis resources:
- Wendy’s Stock Fundamental Analysis Report 2026: Full model with franchisee sensitivity templates.
- Restaurant Operating Margin Benchmarks: 2026 Guide: Baseline labor% and EBITDA margin inputs.
- FreshAI’s Hidden Demographic Edge: Automation offset analysis and AUV impact data.
- How to Analyze Restaurant Stocks: Step-by-step valuation methodology for restaurant equities.