
Wendy’s digital sales are a material upside driver for WEN, but not a standalone fix for the traffic declines weighing on the stock. U.S. digital sales grew 8.4% year-over-year in Q1 2026, reaching a 22.7% mix of total domestic sales — a meaningful channel shift that improves average order value and loyalty retention. The direct implication for EBITDA and free cash flow is positive but modest: digital mix lifts check size and reduces friction, yet the same quarter saw U.S. same-restaurant sales fall 7.8%, driven by weaker traffic, weather, and adjusted operating hours. Digital is improving the revenue quality of each transaction; it is not yet generating enough incremental visits to reverse the volume decline.
Headline metrics to watch next quarter:
- U.S. digital mix (target: sustained above 22.7%)
- 90-day active loyalty members and year-over-year growth rate
- Company-operated comps vs. system comps spread (Q1 2026: +3.1% outperformance)
- FreshAI and digital menu board restaurant count versus stated rollout targets
Table of Contents
- How large are Wendy’s digital sales, and how fast are they growing?
- What does Wendy’s actually count as “digital sales”?
- What technology is actually driving digital adoption at Wendy’s?
- How do digital sales affect Wendy’s margins, EBITDA, and free cash flow?
- What digital sales cannot yet fix — real headwinds for WEN investors
- Which KPIs should investors track each quarter?
- How do digital-sales scenarios translate to WEN valuation?
- How were these figures sourced and calculated?
- How digital channels are reshaping Wendy’s customer base
- Regulatory, privacy, and data-security risks investors should price in
- How Wendy’s digital sales compare to major quick-service peers
- How digital sales growth is influencing WEN’s valuation multiples
- Key Takeaways
- Why digital sales metrics sit at the center of the WEN investment thesis
- Deeper WEN analysis and scenario models from Buywendys
- Primary sources and further reading
How large are Wendy’s digital sales, and how fast are they growing?
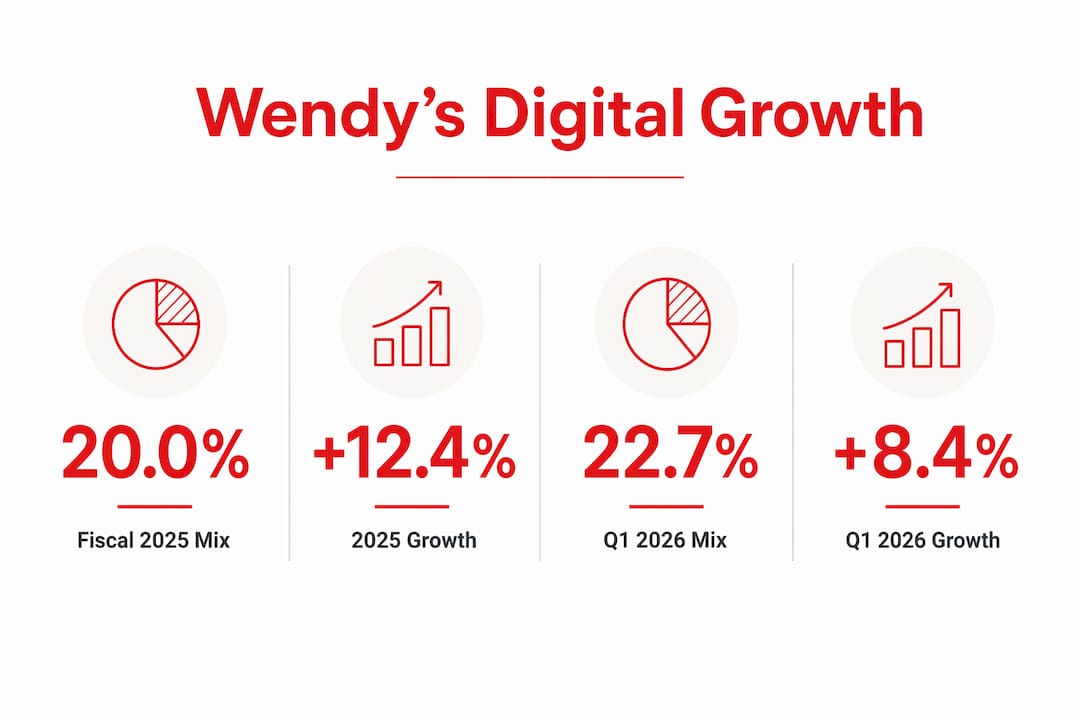
Fiscal 2025 set a record U.S. digital mix of 20.0%, with U.S. digital sales exhibiting a 12.4% year-over-year growth rate for the full year. Q1 2026 pushed that mix to 22.7%, though the year-over-year growth rate slowed to 8.4% compared to prior periods.
| Period | U.S. Digital Mix | U.S. Digital Sales YoY |
|---|---|---|
| Fiscal 2025 (full year) | 20.0% | +12.4% |
| Q1 2026 | 22.7% | +8.4% |
On the technology rollout side, voice AI ordering is live in roughly 100 restaurants and digital menu boards are deployed in 300+ locations, with management targeting broader system expansion. These figures represent early-stage penetration across a system of approximately 7,251 restaurants globally as of Q1 2026.
What does Wendy’s actually count as “digital sales”?
Management’s definition of digital sales covers transactions initiated through the mobile app, the web ordering interface, third-party delivery platforms, in-restaurant kiosks, and AI-assisted drive-thru ordering via FreshAI. Understanding the scope matters for modeling because each channel carries different economics.
- Mobile app and web orders: highest loyalty capture; app-exclusive offers drive repeat frequency.
- Third-party delivery: included in digital mix but carries platform commission costs that compress restaurant-level margin.
- Kiosks and digital menu boards: in-restaurant digital touchpoints that lift upsell rates and order accuracy.
- FreshAI drive-thru: voice-AI ordering that routes transactions digitally, capturing data and enabling personalization.
A critical reporting caveat: Wendy’s reports digital mix as a percentage of systemwide sales, but franchise restaurant sales do not flow through company revenue. Royalties are computed as a percentage of franchisee sales, so a digital-mix improvement at franchised units lifts royalty revenue — but the margin capture differs from company-operated restaurants. When building a model, normalize for this by separating company-operated restaurant margin from royalty revenue sensitivity.
Pro Tip: When modeling digital-mix sensitivity, run two separate scenarios: one for company-operated units (where digital efficiency flows to restaurant-level margin) and one for franchised units (where the benefit accrues via royalty revenue and potentially lower franchisee churn). Blending them without adjustment overstates corporate margin leverage.
What technology is actually driving digital adoption at Wendy’s?
Three mechanisms are doing the most work: FreshAI, Project Fresh’s operational standards, and the loyalty recommendation engine.
FreshAI is Wendy’s branded AI voice-ordering system for drive-thrus. Where deployed, it handles order-taking autonomously, routes upsell suggestions based on predictive analytics, and reduces labor dependency at the point-of-sale. The system targets conversion lift and average order value improvement without relying on discount-led traffic.
Project Fresh ties digital modernization to operational standards across both company-operated and franchised restaurants. The program includes White Glove cleanliness protocols, label printer deployment, and crew training. Label printers drove approximately a 170-basis-point improvement in order accuracy, and cleanliness scores improved roughly 160 basis points after White Glove program rollout. Company-operated restaurants implementing these standardized protocols outperformed the broader U.S. system by 3.1% in Q1 2026.
“Management noted that restaurants with higher customer satisfaction scores significantly outperform weaker locations, underscoring the importance of operational execution alongside digital investment.” — Q1 2026 management commentary via Yahoo Finance
The loyalty and personalization layer is the third driver. Wendy’s has a very large reward membership base, and management consistently cites loyalty customers as higher-value: they visit more frequently and spend more per visit. An AI recommendation engine integrated into the mobile app personalizes suggestions by cart contents, location, and seasonality — targeting conversion and average order value simultaneously.
How do digital sales affect Wendy’s margins, EBITDA, and free cash flow?
Digital channels improve revenue quality in two ways: higher average order value from upsell and personalization, and lower order-error costs from improved fulfillment accuracy. Both flow toward restaurant-level margin, though the magnitude depends on channel mix and franchise structure.
| Scenario | Digital Mix Assumption | Direction of EBITDA Impact | Key Driver |
|---|---|---|---|
| Bear | Mix stalls at 22–23% | Neutral to slightly negative | Traffic declines offset AOV gains |
| Base | Mix reaches 25–26% by year-end | Modest positive | Loyalty frequency + AOV lift |
| Bull | Mix exceeds 28% with FreshAI scale | Meaningfully positive | Labor efficiency + royalty uplift |
Wendy’s 2026 full-year guidance targets adjusted EBITDA and free cash flow within guidance ranges consistent with prior disclosures. Digital mix improvement is a lever within that range, not the primary driver. A 1–2 percentage-point increase in digital mix, assuming higher AOV and modestly better order accuracy, provides incremental support to restaurant-level margin — but the sensitivity is bounded by the franchise structure, where roughly 95% of restaurants are franchised and corporate captures the benefit through royalties rather than direct margin.
For a detailed free cash flow framework, Buywendys’s Wendy’s free cash flow guide walks through the calculation with digital-mix sensitivity inputs.
What digital sales cannot yet fix — real headwinds for WEN investors
Digital momentum is encouraging but not sufficient to offset weaker store traffic and macro pressures in the near term. The structural limits are worth modeling explicitly:
- Demand-side pressure: U.S. same-restaurant sales fell 7.8% in Q1 2026. Lower-income consumers remain cautious, and inflationary pressures on food costs and discretionary spending continue to suppress visit frequency across the system.
- Uneven franchise adoption: Project Fresh and FreshAI deployment depend on franchisee buy-in and capital allocation. With roughly 95% of the system franchised, the pace of tech rollout is not fully within corporate control.
- Technology coverage gaps: Voice AI is live in only about 100 restaurants. At that penetration rate, system-level impact on digital mix from FreshAI alone remains limited.
- Data and privacy exposure: Expanding AI-driven personalization and loyalty data collection increases regulatory and cybersecurity risk. Wendy’s 10-K explicitly lists cybersecurity incidents and digital commerce platform failures as material risk factors.
- Red-flag scenario: If franchise adoption of Project Fresh stalls and traffic declines accelerate, digital mix gains could be entirely offset by volume losses, leaving EBITDA below the low end of guidance.
Which KPIs should investors track each quarter?
- U.S. digital mix (% of domestic sales): the primary indicator of channel shift momentum; watch for sustained progress above 22.7%.
- 90-day active loyalty members: management’s preferred engagement metric; growth here signals future frequency and AOV support.
- Average order value for digital channels: not always separately disclosed, but can be inferred from check-size commentary in earnings calls.
- Company-operated comps vs. system comps spread: the +3.1% Q1 2026 outperformance is the clearest signal that Project Fresh is working where implemented.
- FreshAI and digital menu board restaurant count: track against stated rollout targets to assess execution pace.
- Technology Initiatives capex allocation: rising tech spend relative to new unit capex signals management prioritization; watch for any guidance revision.
- Franchise royalty revenue trend: since franchisee digital sales flow to corporate via royalties, this line is the financial translation of system-wide digital progress.
Pro Tip: Cross-reference the company-operated comp spread with the FreshAI and Project Fresh restaurant count each quarter. If the spread narrows as rollout expands, it may indicate diminishing returns or execution inconsistency — a signal to revisit the base-case scenario.
For a structured quarterly monitoring checklist, Buywendys’s fast food stock investment research guide provides a reusable framework.
How do digital-sales scenarios translate to WEN valuation?
| Scenario | Digital Mix (Year-End) | EBITDA Direction | Investor Implication |
|---|---|---|---|
| Bear | Stalls at 22–23% | Below guidance range | Multiple compression; traffic declines dominate |
| Base | Reaches 25% or more | Within $460 million guidance range | Modest re-rating if FCF supports dividend |
| Bull | Exceeds 28% with FreshAI scale | Above guidance midpoint | Potential multiple expansion; loyalty flywheel narrative |
The most value-accretive driver in the bull scenario is not AOV lift alone — it is the combination of FreshAI-driven labor efficiency at company-operated units and franchise royalty uplift from higher systemwide digital sales. AOV improvements are real but bounded; labor cost reduction at scale is where the EBITDA leverage lives. Investors should weight adoption speed and labor efficiency more heavily than AOV in their scenario inputs.
Pro Tip: Use restaurant stock valuation metrics to calibrate EV/EBITDA sensitivity to digital-mix changes before applying a target multiple to any scenario.
For a full probability-weighted scenario model, Buywendys’s WEN bull vs. bear case analysis maps these inputs to price targets.
How were these figures sourced and calculated?
The headline statistics in this article draw from Wendy’s Q1 2026 earnings call transcript, the company’s Q4 and full-year 2025 press release, and management commentary reported by QSR Magazine, Restaurant Dive, Diginomica, and Yahoo Finance. Scenario inputs are framework-based, derived from management guidance ranges and directional commentary rather than proprietary forecasts.
| Statistic | Period | Source |
|---|---|---|
| U.S. digital mix 22.7%; +8.4% YoY | Q1 2026 | Wendy’s Q1 2026 Earnings Call (Motley Fool transcript) |
| U.S. digital mix 20.0%; — YoY | Fiscal 2025 | InfotechLead / company release |
| Company-operated outperformance +3.1% | Q1 2026 | QSR Magazine |
| Label printer order accuracy +170 bps | Q1 2026 | Restaurant Dive |
| Voice AI ~100 restaurants; digital menu boards 300+ | Q1 2026 | Diginomica |
| Adjusted EBITDA guidance $460–$480M; FCF ~$190M | FY2026 guidance | Wendy’s IR / Q4 2025 release |
Buywendys updates scenario models as new quarterly data is released. Readers who use these figures as model inputs should verify against the most recent 10-Q filing and earnings transcript.
How digital channels are reshaping Wendy’s customer base
Digital ordering disproportionately attracts younger, higher-frequency customers — particularly millennials and Gen Z consumers who default to app-based ordering and delivery. Loyalty program members, who skew toward these cohorts, show measurably higher check sizes and visit frequency than non-loyalty guests, per management disclosures. This demographic concentration has a compounding effect: as the loyalty base grows, the average revenue per user rises, and the data Wendy’s collects on ordering behavior improves the precision of personalized offers.
The behavioral shift also affects daypart distribution. Digital channels tend to over-index on lunch and late-night, where convenience and speed drive the decision. For investors, this matters because daypart diversification — particularly breakfast, where Wendy’s has invested heavily in marketing — is harder to capture through digital alone without targeted app promotions. Buywendys’s Gen Z strategy analysis covers the demographic targeting mechanics in depth.
Regulatory, privacy, and data-security risks investors should price in
Wendy’s 10-K explicitly identifies cybersecurity incidents, digital platform failures, and data privacy compliance as material risk factors. As FreshAI and the loyalty program collect more granular behavioral data — order history, location, payment preferences — the regulatory surface area expands. State-level privacy laws, including the California Consumer Privacy Act and analogous statutes in other states, impose data handling obligations that add compliance cost and litigation exposure.
Voice AI ordering introduces an additional layer: biometric and voice data collection may trigger specific state regulations beyond standard consumer privacy frameworks. Wendy’s has not publicly disclosed the full scope of its data retention and processing practices for FreshAI-captured interactions. For investors, this is a tail risk rather than a near-term earnings driver, but it warrants monitoring as FreshAI scales from 100 restaurants toward broader system deployment.
How Wendy’s digital sales compare to major quick-service peers
Wendy’s 22.7% U.S. digital mix in Q1 2026 is a credible result for a mid-scale quick-service chain, but it trails the digital penetration reported by the largest players in the sector. The leading quick-service operators have built digital ecosystems with global loyalty programs, dedicated app infrastructure, and multi-year delivery partnerships that generate digital mixes well above 30% in their most mature markets.
Wendy’s competitive position is not primarily about closing a percentage-point gap in digital mix. The more relevant question is whether digital investment translates to traffic recovery and margin improvement faster than peers can extend their own advantages. Wendy’s has a narrower unit base and a more concentrated U.S. footprint, which means FreshAI and Project Fresh can theoretically be deployed with more consistency than a global operator managing tens of thousands of locations. The fast food industry stock trends guide on Buywendys provides sector-level digital benchmarking context for positioning WEN against the broader peer group.
How digital sales growth is influencing WEN’s valuation multiples
Investor sentiment on WEN has been cautious through 2025 and into 2026, with the stock reflecting the traffic declines and same-restaurant sales pressure more than the digital progress. The market is applying a show-me posture: digital mix improvement is acknowledged, but the multiple will not expand materially until digital gains translate into positive system comps.
The mechanism is straightforward. Wendy’s is a predominantly franchised model, so EBITDA is heavily weighted toward royalty revenue and rent income rather than restaurant-level margin. A sustained digital mix above 25%, combined with stabilizing traffic, would improve royalty revenue growth and support the free cash flow needed to maintain the dividend and service the securitized debt. That combination — not digital mix in isolation — is what drives multiple re-rating. Until system comps turn positive, the digital narrative functions as a partial offset to the bear case rather than a standalone catalyst for multiple expansion.
Key Takeaways
Wendy’s digital sales are a measurable positive for revenue quality and margin efficiency, but the stock thesis requires traffic stabilization alongside digital growth to support valuation re-rating.
| Point | Details |
|---|---|
| Digital mix at 22.7% | Q1 2026 U.S. digital mix reached 22.7%, up from a record 20.0% in fiscal 2025. |
| Partial offset, not a fix | Digital growth helps AOV and loyalty retention but has not reversed the 7.8% U.S. same-restaurant sales decline. |
| Project Fresh outperformance | Company-operated restaurants using standardized protocols outperformed the U.S. system by 3.1% in Q1 2026. |
| FreshAI coverage is early-stage | Voice AI is live in roughly 100 restaurants; system-level impact is limited until rollout scales. |
| Buywendys scenario models | Buywendys translates digital-mix changes into EBITDA and FCF scenarios with quarterly updates for investors. |
Why digital sales metrics sit at the center of the WEN investment thesis
The conventional framing treats digital sales as a marketing story — app downloads, loyalty points, social promotions. That framing misses the actual investment signal. What digital mix measures, at its core, is the share of transactions where Wendy’s has a direct data relationship with the customer. That relationship is what enables personalized pricing, targeted promotions, and loyalty-driven frequency — all of which improve revenue per visit without requiring new unit growth.
The risk that most coverage underweights is franchise adoption. Project Fresh’s digital components are only as effective as the franchisee network that implements them. With roughly 95% of the system franchised, corporate cannot mandate technology adoption at the pace a fully company-operated chain could. The +3.1% comp outperformance at company-operated restaurants is a proof of concept, not a system-wide result. Investors who model the bull case should stress-test the assumption that franchisees adopt at the same pace and fidelity as company-operated units — because the historical record on franchise technology rollouts across the industry suggests they rarely do.
Deeper WEN analysis and scenario models from Buywendys
Buywendys publishes quarterly-updated scenario models that convert Wendy’s digital-mix changes directly into EBITDA and free cash flow ranges, with downloadable inputs for analysts who want to run their own sensitivity analysis.

The WEN fundamental analysis report covers franchise economics, royalty revenue sensitivity, and the full Project Fresh capex timeline — the inputs that matter most for translating digital progress into a price target. For investors focused specifically on FreshAI’s unit-level economics, the FreshAI franchise margin analysis breaks down how AI-driven efficiency changes franchisee returns and corporate fee capture. Both reports are updated as new quarterly data is released. Access the full model suite at Buywendys to track the KPIs that move the WEN thesis.
Primary sources and further reading
- Wendy’s Q1 2026 Earnings Call Transcript — Motley Fool: primary source for Q1 2026 digital mix (22.7%) and YoY growth (8.4%); use for comps detail and management commentary.
- Wendy’s Q4 and Full Year 2025 Results — Wendy’s IR: full-year 2025 digital mix (20.0%), EBITDA and FCF guidance for 2026.
- Wendy’s Q1 2026 Press Release — PR Newswire: operational highlights table, same-restaurant sales, and management statements on Project Fresh.
- Wendy’s bets on Project Fresh — QSR Magazine: company-operated outperformance (+3.1%) and Project Fresh rollout detail.
- Wendy’s order accuracy and cleanliness — Restaurant Dive: label printer accuracy gains (~170 bps) and White Glove program results.
- How Wendy’s found its digital ‘secret sauce’ — Diginomica: FreshAI deployment scope, loyalty program scale, and digital strategy context.
- Can Wendy’s digital sales offset weak traffic? — Yahoo Finance: analyst perspective on digital momentum limits and AI recommendation engine integration.
- Wendy’s Project Fresh and AI transformation — InfotechLead: fiscal 2025 digital milestones and 2026 capex guidance context.