
DoorDash is the stronger platform for restaurant partners and suburban market reach; Uber Eats holds the edge in consumer spend capture through ecosystem bundling. For Wendy’s investors, the distinction matters because each platform applies different commission pressure, subscription economics, and menu markup dynamics on the same franchisee P&L.
Industry data places DoorDash at a dominant U.S. market share in the first half of 2025, a scale advantage that gives it significant leverage in merchant negotiations. Uber Eats counters with Uber One, which bundles ride-hailing and delivery benefits to lift account-level lifetime value in ways DoorDash cannot replicate through DashPass alone.
Statistic callout: Live-order sampling found Uber Eats averaging ~$28.60 per order versus DoorDash’s ~$34.20, an 18% gap driven primarily by lower delivery and service fees.
Pro Tip: Model basket-level totals, not advertised base fees. Menu markups and dynamic surges mean the checkout price diverges materially from headline fee schedules, and that divergence directly affects franchisee royalty-eligible net sales.
| Dimension | DoorDash | Uber Eats | Grubhub |
|---|---|---|---|
| U.S. market share / scale | ~67% (H1 2025) | Second-largest U.S. player | Primarily urban/college markets |
| Merchant count (U.S.) | — | Large national catalog | — |
| Take rate / commission | 15%–30% delivery; 6% pickup | Up to 15% service fee to consumer | Variable; competitive in cities |
| Subscription | DashPass subscription service | Uber One subscription service combining rides and delivery | Grubhub+ subscription service available free with Amazon Prime |
| Avg. delivery time (sampled) | ~32 min | ~28 min | — |
| Avg. order cost (sampled) | ~$34.20 | ~$28.60 | Competitive on larger orders |
| Logistics model | Independent Dashers; suburban/rural focus | Leverages Uber driver network | Independent couriers; city-dense |
| Ecosystem advantage | DashPass + merchant exclusives | Uber ride + delivery bundling | Amazon Prime integration |
| Regulatory / labor exposure | High (gig classification risk) | High (gig classification risk) | Moderate (smaller scale) |
Investor-ready evidence points:
- DoorDash’s large merchant count creates a distribution moat in suburban and rural markets where Wendy’s franchisee density is highest.
- Uber Eats’ ecosystem lock-in via Uber One cross-vertical bundling raises consumer switching costs in urban cores, which affects Wendy’s urban unit volumes.
- Commission rates on delivery orders compress franchisee-level margins before royalties are calculated, a direct input to franchise operating margin models.
- Subscription programs like DashPass and Uber One can mask base menu inflation; analysts should model membership penetration and per-order price inflation together to estimate true membership ROI.
- City-level winners vary: DoorDash leads in many suburban markets while Uber Eats outperforms in certain metro corridors, meaning Wendy’s same-store sales exposure differs by franchisee geography.
Table of Contents
- How do DoorDash and Uber Eats price orders at checkout?
- How do the business models of DoorDash and Uber Eats differ?
- What do unit economics look like for each platform?
- How do merchant commissions and promotional dynamics work?
- What is the regulatory and labor-cost exposure for each platform?
- What are the implications for Wendy’s specifically?
- How do DoorDash and Uber Eats differentiate on brand and customer experience?
- What are the growth and expansion strategies for each platform?
- What are the key risks facing both platforms?
- What does the financial performance of each platform show?
- How are AI and technology reshaping delivery platform economics?
- What do customer demographics reveal about each platform’s strategic position?
- Buywendys analysis: the next step for WEN investors
- Key Takeaways
How do DoorDash and Uber Eats price orders at checkout?
Headline delivery fees are not the reliable cost metric most consumers assume. Menu markups and dynamic surges materially affect the final checkout price, and those markups are largely invisible until the order is placed. Restaurants commonly raise in-app menu prices by 10%–20% to offset platform commissions, which can reach 30%. That inflation flows through to the consumer’s total and, critically, to the royalty-eligible net sales figure that Wendy’s corporate collects from franchisees.
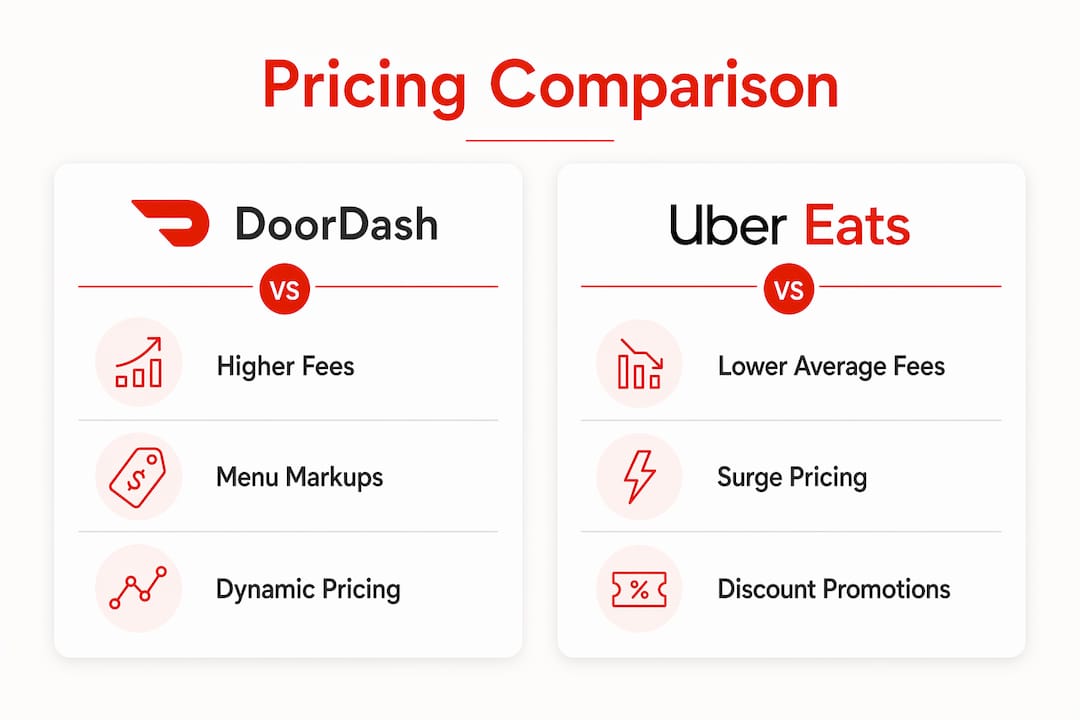
DoorDash’s sampled average order cost is higher than Uber Eats, reflecting this dynamic. The gap is not purely a fee difference; it also captures menu pricing decisions by individual restaurant operators on each platform. For analysts, the practical implication is that modeling delivery revenue using base fee schedules understates true consumer cost and overstates franchisee net margin.
How do the business models of DoorDash and Uber Eats differ?
The contest between these two platforms has shifted from geographic coverage to ecosystem lock-in. DoorDash built its position on merchant density and suburban reach, using DashPass to drive repeat spend and exclusive merchant deals to keep restaurants reliant on its distribution. Uber Eats takes a different route: Uber One bundles ride-hailing and delivery into a single membership, raising the cost of switching away from the entire Uber account rather than just the food app.
For Wendy’s investors, this distinction shapes which platform exerts more pricing power over franchisees in a given market. DoorDash’s suburban dominance aligns closely with Wendy’s franchisee footprint, making its commission structure the more material input for most WEN unit-level models. Uber Eats’ urban ecosystem advantage matters more for high-volume city locations where Uber One penetration is higher and consumer switching costs are elevated.

What do unit economics look like for each platform?
Delivery economics remain structurally challenged for both platforms. Commission rates on delivery orders are the primary revenue lever for DoorDash and Uber Eats, but logistics costs, including driver pay, insurance, and routing, consume a significant share of that take. DoorDash reports driver base pay varies per order; Uber Eats drivers generally earn more per hour than DoorDash Dashers, a cost differential that affects each platform’s contribution margin per delivery.
The path to profitability for both companies runs through subscription penetration and advertising revenue rather than per-order delivery margins alone. DashPass and Uber One reduce per-order logistics costs by concentrating order volume among high-frequency users, while merchant advertising products (sponsored listings, promoted placements) generate higher-margin revenue that subsidizes delivery economics. Analysts modeling Wendy’s third-party delivery exposure should weight advertising revenue growth as a signal of platform health, since a platform with deteriorating ad revenue is more likely to increase commission pressure on restaurant partners.
How do merchant commissions and promotional dynamics work?
Commission structures on both platforms follow a tiered model. DoorDash charges 6% for pickup orders and 15%–30% for delivery, depending on the merchant’s chosen package. Uber Eats applies comparable commission ranges. These rates directly reduce franchisee-level contribution before royalties, which Wendy’s corporate collects as a percentage of net sales. The product-level margin impact varies by order mix, since high-margin items like beverages and fries carry the commission burden differently than lower-margin entrées.
Promotional dynamics add another layer. DoorDash runs daily promotions; Grubhub runs them roughly biweekly. Merchant-funded promotions on these platforms shift the cost of discounting to the restaurant operator, compressing margins further. Wendy’s franchisees participating in platform-sponsored deals absorb that cost directly, which is why the Wendy’s app and first-party digital ordering represent a structurally higher-margin channel.
What is the regulatory and labor-cost exposure for each platform?
Both DoorDash and Uber Eats face material gig-worker classification risk in the U.S. Several states have pursued legislation that would reclassify delivery drivers as employees, triggering payroll taxes, benefits obligations, and minimum wage floors that would substantially increase per-delivery costs. California’s AB5 litigation and subsequent ballot measures established the legal template that other states are now referencing.
If driver reclassification advances at the federal level or in key states, the cost increase would likely be passed through to merchants via higher commission rates or to consumers via higher fees, or both. For Wendy’s, either outcome compresses franchisee margins or reduces delivery order volume, both of which flow through to royalty revenue. This regulatory variable belongs in any sensitivity table built around third-party delivery penetration assumptions.
What are the implications for Wendy’s specifically?
Third-party delivery platforms affect Wendy’s through three channels: commission drag on franchisee margins, menu markup inflation that can suppress order frequency, and the competitive tension between platform-owned loyalty programs and Wendy’s own digital strategy. DoorDash’s suburban dominance is the most relevant factor for the majority of Wendy’s franchisees, given the chain’s concentration outside major urban cores.
Wendy’s FreshAI drive-thru technology represents a direct response to this pressure. By capturing orders through the drive-thru channel rather than third-party apps, Wendy’s retains the full transaction value without paying platform commissions. The royalty math is straightforward: a $10 drive-thru order generates a higher royalty contribution than the same $10 order placed through DoorDash after a 25% commission is deducted. Scaling FreshAI across the franchisee network is therefore a margin-accretive strategy relative to growing third-party delivery penetration.
Wendy’s loyalty program and app-based ordering also compete directly with DashPass and Uber One for consumer habit formation. The platform that owns the consumer’s ordering routine captures the data and the repeat spend. For WEN investors, the strategic question is whether Wendy’s first-party digital channels can grow fast enough to offset the margin dilution from third-party delivery volume.
How do DoorDash and Uber Eats differentiate on brand and customer experience?
DoorDash competes on selection breadth and reliability, particularly in markets where Uber Eats has thinner driver coverage. Its order accuracy rate of 94.2% in sampled data compares favorably to Grubhub’s 91.8%, and its in-app resolution process for order issues is largely automated and fast. Uber Eats differentiates on delivery speed, being slightly faster than DoorDash in sampled datasets and on the cross-platform convenience of the Uber account.
Customer service quality is a retention variable that analysts sometimes underweight. Platforms with higher order accuracy deliver lower churn among high-frequency users, the cohort that drives disproportionate gross transaction value. For restaurant partners, order accuracy also affects ratings and reorder rates, which feed back into platform algorithmic placement.
What are the growth and expansion strategies for each platform?
DoorDash has extended beyond restaurant delivery into grocery, convenience, and alcohol delivery, using DashPass to anchor subscribers across verticals. Internationally, DoorDash operates in Canada and Australia. Uber Eats’ international footprint is broader, covering major cities across Europe, Asia-Pacific, and Latin America, leveraging the existing Uber ride-hailing infrastructure in each market to reduce driver acquisition costs.
For investors modeling platform durability, vertical diversification is the key growth signal. A platform that captures grocery and convenience spend alongside restaurant orders increases the frequency of consumer touchpoints and the stickiness of its subscription product. DoorDash’s U.S. suburban coverage gives it a structural advantage in grocery delivery markets where Instacart and other competitors have less penetration.
What are the key risks facing both platforms?
Market saturation in dense urban areas is the most immediate risk. Both DoorDash and Uber Eats have high restaurant penetration in major metros, leaving suburban and rural expansion as the primary organic growth lever. New entrants, including grocery chains with proprietary delivery infrastructure and quick-commerce operators, are competing for the same consumer wallet share.
Dependency on third-party restaurants creates concentration risk on both sides. Restaurants that build sufficient first-party digital ordering volume, as Wendy’s is attempting with FreshAI and its app, have incentive to reduce platform dependency. If major chains migrate volume to owned channels, platform GTV growth slows and the merchant advertising revenue that subsidizes delivery economics contracts. The beef cost and margin pressure that Wendy’s franchisees face in 2026 makes this calculus more acute: every commission dollar paid to a delivery platform is a dollar that does not reach the franchisee’s operating income.
What does the financial performance of each platform show?
DoorDash has reported consistent GTV growth, with its scale advantage in merchant count and order volume translating into advertising revenue growth that is outpacing delivery fee revenue. Uber Eats benefits from Uber’s consolidated reporting, which allows the delivery segment to absorb some overhead costs shared with the mobility business, a structural cost advantage DoorDash does not have.
Profitability trends for both platforms show improving contribution margins as subscription penetration rises and advertising revenue scales. However, neither platform has demonstrated the kind of durable free cash flow generation that characterizes mature consumer platforms. For WEN investors, the relevant financial metric is not platform profitability per se but platform health as a proxy for commission stability: a financially stressed platform is more likely to increase merchant fees or reduce promotional support, both of which affect franchisee economics.
How are AI and technology reshaping delivery platform economics?
Both DoorDash and Uber Eats deploy predictive analytics for route optimization, demand forecasting, and dynamic pricing. Route optimization directly affects per-delivery logistics costs; a 5% improvement in route efficiency at DoorDash’s order volume translates into material cost savings. Dynamic pricing algorithms adjust delivery fees and surge pricing in real time based on driver supply and consumer demand, which is the mechanism behind the checkout price variance that analysts need to model at the basket level rather than the fee-schedule level.
Uber Eats’ integration with Uber’s broader data infrastructure gives it an advantage in demand forecasting, since ride-hailing patterns provide leading indicators of consumer location and intent. DoorDash has invested in its own logistics technology, including proprietary dispatch algorithms and driver routing tools. For Wendy’s, the parallel technology investment is FreshAI, which applies generative AI to drive-thru order-taking to reduce labor costs and improve order accuracy at the point of sale.
What do customer demographics reveal about each platform’s strategic position?
DoorDash’s suburban and rural strength skews its user base toward families and households ordering from national chains, a demographic profile that aligns closely with Wendy’s core customer. Uber Eats’ urban concentration and ride-hailing integration attract a younger, higher-income urban demographic that orders more frequently but from a more diverse restaurant set.
For Wendy’s investors, the demographic alignment with DoorDash is the more material insight. Wendy’s franchisee base is concentrated in suburban and secondary markets where DoorDash holds the distribution advantage. That alignment means DoorDash commission rates and DashPass penetration are the primary third-party delivery variables in a WEN unit-level model, not Uber Eats’ urban metrics.
Buywendys analysis: the next step for WEN investors
Buywendys publishes independent research and financial analysis on Wendy’s (NASDAQ: WEN) for investors who need more than a platform comparison. The Wendy’s stock valuation analysis translates the delivery platform dynamics covered here into concrete model inputs: commission drag on franchisee margins, DashPass penetration sensitivity, menu markup assumptions, and FreshAI-driven channel shift scenarios.
The Buywendys research framework includes modular scenario inputs for GTV, take rate, and subscription penetration, with sensitivity tables for labor regulation changes and menu markup inflation. Analysts can swap in local market assumptions to simulate same-store sales impact under varying third-party delivery stress scenarios. The fast food industry stock trends coverage provides the broader competitive context. Access the full valuation model and scenario analysis at Buywendys to build your WEN position on sourced, structured data rather than headline fee comparisons.
Key Takeaways
DoorDash holds ~67% U.S. market share and is the primary third-party delivery variable in a WEN franchisee unit-level model, given its suburban market alignment with Wendy’s footprint.
| Point | Details |
|---|---|
| DoorDash market dominance | ~67% U.S. share in H1 2025 gives DoorDash outsized merchant negotiating leverage and suburban distribution reach. |
| Order cost gap | Sampled data shows DoorDash averaging ~$34.20 per order versus Uber Eats’ ~$28.60, an 18% difference driven by fees and menu markups. |
| Commission drag on WEN | Platform commissions of 15%–30% reduce franchisee-level margin before Wendy’s royalties are calculated, making delivery mix a direct P&L input. |
| Subscription economics | DashPass and Uber One can mask base menu inflation; model membership penetration and per-order price inflation together for accurate ROI estimates. |
| Buywendys model inputs | Buywendys translates these platform dynamics into modular WEN valuation scenarios, including commission sensitivity and FreshAI channel-shift assumptions. |
Recommended
- FreshAI and Wendy’s Stock: Can AI Drive-Thru Ordering Improve WEN’s Investor Case? – Buy Wendy’s
- Wendy’s AI Drive-Thru Revenue Impact: 2026 Stock Analysis
- How the Wendy’s App Turned a Family Ordering Habit Into a WEN Stock Research Project – Buy Wendy’s
- Wendy’s Stock Volatility Analysis: WEN Price Drivers