
Third-party restaurant foot traffic data gives analysts an objective, time-series denominator for conversion that no earnings release provides on its own. Link visit counts to POS or royalty figures and you can estimate same-store sales (SSS) shifts weeks before a quarterly report, detect store-level deterioration early, and test whether operational initiatives like Wendy’s FreshAI drive-thru AI are actually moving throughput.
Quick signals to act on now:
- RetailNext’s Aurora® sensor claims 95–99% counting accuracy for audited installations, which makes it a useful benchmark when evaluating sensor-based vendor claims.
- FreshAI is an active operational variable at Wendy’s drive-thrus; any traffic model that ignores it risks misattributing throughput changes to demand rather than process.
- Buywendys maintains the Project Fresh closure tracker and SSS-linked valuation reports, giving analysts a pre-built layer to cross-reference against third-party visit signals.
Immediate action: Pull a sample panel from Placer.ai, SafeGraph, or Unacast, define a trade-area polygon around a cluster of Wendy’s locations, and verify the vendor’s visit-to-transaction linkage before scaling any revenue estimate.
Table of Contents
- Why restaurant foot traffic data changes how you read Wendy’s SSS
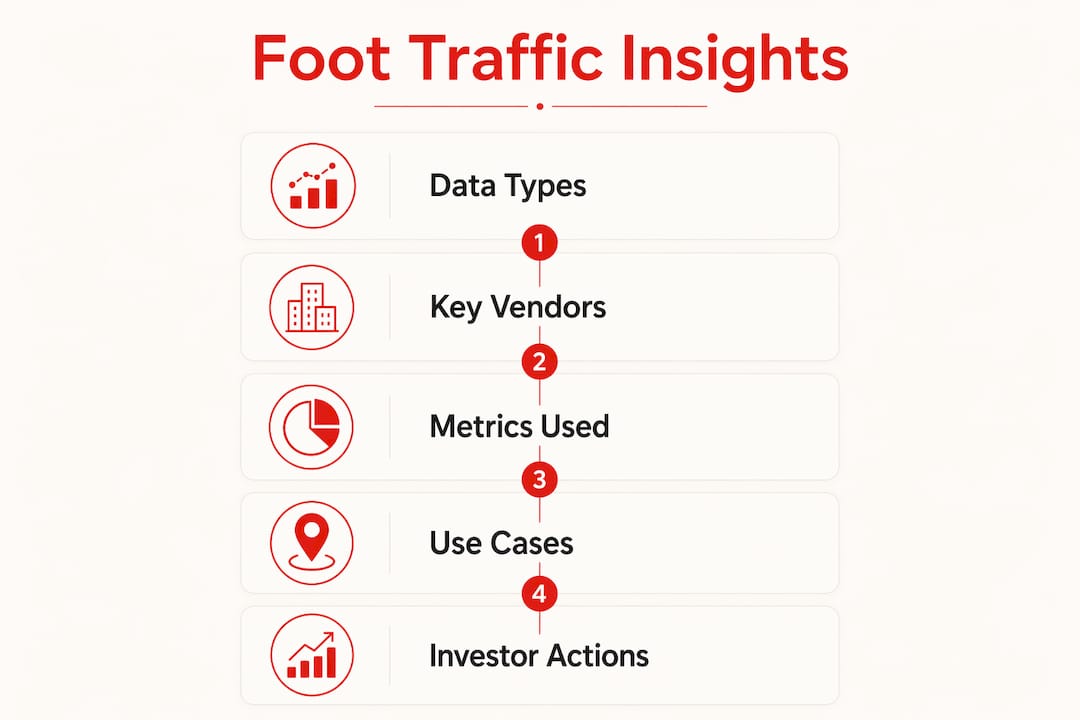
- Primary data types and U.S. vendors analysts should know
- How to turn raw visit counts into investor-ready metrics
- How analysts use foot traffic to value Wendy’s
- Worked example: converting visitor counts into a same-store-sales estimate
- What can mislead your analysis
- What to ask a vendor before trusting their data
- Key Takeaways
- How Buywendys integrates foot traffic into its Wendy’s analysis
- Buywendys gives analysts a structured starting point
- Useful sources and further reading
Why restaurant foot traffic data changes how you read Wendy’s SSS
Looking at reported same-store sales alone tells you the outcome, not the cause. A visit denominator separates the two. If SSS rises 3% but visit counts are flat, the gain is ticket-size driven, which carries different margin implications than a genuine traffic increase. If visits are up but SSS is flat, conversion or average order value (AOV) is the problem, and that points to operational issues rather than demand.
95–99% — RetailNext’s vendor-stated counting accuracy for its Aurora® sensor at audited installations. Even a 1% improvement in measured conversion accuracy changes the revenue estimate for a high-volume Wendy’s unit by a meaningful amount across hundreds of locations.
Third-party foot traffic datasets provide a consistent, objective benchmark that lets analysts compare Wendy’s performance across the fast-food sector without requiring proprietary internal data. That cross-brand benchmarking is the core analytical advantage over relying solely on disclosed financials. For Wendy’s specifically, where roughly 95% of units are franchised and royalty revenue is the primary top-line driver, a visit-based signal that leads royalty reporting by days or weeks is a genuine edge in near-term earnings modeling.
Primary data types and U.S. vendors analysts should know
Foot traffic analytics draws from four distinct collection methods, each with different coverage and investor utility:
- Mobile location panels (Placer.ai, SafeGraph, Foursquare, Unacast): GPS and SDK-derived signals from opted-in devices. The only method that provides trade-area context, journey data, and cross-brand benchmarking at scale. Near-real-time update cadences make these the primary tool for investor-grade analysis.
- Thermal and camera sensors (RetailNext): Door-level counts with high accuracy when audited. Best for conversion rate calculation at specific locations, but limited to stores where hardware is installed.
- Beacons and Wi-Fi probes: Captures devices that ping a network. Coverage is inconsistent and increasingly limited by device privacy settings, making this a supplementary rather than primary source.
- POS and payment linkage: Ties visit counts directly to transactions. The gold standard for conversion rate validation, but requires a data-sharing agreement with the operator or franchisee.
For Wendy’s analysis, FreshAI is a variable that cuts across all four. The AI-powered drive-thru ordering system, deployed across a growing share of Wendy’s U.S. locations, can alter throughput and dwell time independently of demand. An analyst using sensor or mobile data to track drive-thru AI revenue impact must control for FreshAI rollout timing to avoid misreading a throughput gain as a demand signal.
MRI OnLocation reports metrics at the scale of tens of millions of weekly pedestrian counts across thousands of U.S. locations, while Ticon’s C-Site platform provides AADT, hourly counts, and 15-minute interval breakdowns specifically useful for drive-thru stop-potential analysis.

How to turn raw visit counts into investor-ready metrics
The method is straightforward: define a geofence, clean the data, anchor conversion to POS, apply ticket-size assumptions, and compute SSS. Each step requires deliberate choices that affect the output.
- Define the trade-area polygon. Draw a geofence around each Wendy’s location using drive-time isochrones (typically 3–5 minutes for QSR) rather than a simple radius. Trade-area context matters because high passing traffic does not guarantee convertible visits if vehicle speed, co-tenancy, or demographics do not align with Wendy’s customer profile.
- Deduplicate and normalize. Remove staff pings (identified by dwell-time patterns and repeat daily visits), filter drive-by passes at drive-thrus using speed thresholds, and normalize raw panel counts against regional population coverage to correct for device-OS and demographic skew.
- Establish a conversion anchor. Link deduplicated visit counts to POS transaction data or Wendy’s disclosed royalty figures for a baseline period. This gives you a conversion rate (transactions ÷ unique visits) that you can hold constant or adjust as a sensitivity variable.
- Apply AOV assumptions. Use Wendy’s reported average check or a proxy from disclosed revenue per unit. Multiply: unique visits × conversion rate × AOV = estimated revenue.
- Compute SSS and traffic-normalized metrics. Compare the current period’s estimated revenue to the same period in the prior year. Separate the visit-count effect from the ticket-size effect to isolate the true traffic contribution to SSS.
- Validate against reported data. Spot-check your estimates against Wendy’s quarterly royalty disclosures and any disclosed SSS figures. A persistent gap signals a flawed conversion anchor or normalization error.
Pro Tip: Before scaling estimates across all U.S. Wendy’s locations, validate the vendor’s panel against POS data for 3–5 stores in different markets. Check panel size by DMA, update cadence, and the vendor’s documented deduplication rules. A sample that looks accurate nationally can be significantly off in lower-density markets, where device coverage thins.
RetailNext’s traffic analytics platform supports 15-minute interval data delivery, which matters for near-term earnings signals. Weekly or monthly update cadences are adequate for trend analysis but too slow to catch a same-week demand shift ahead of a guidance revision.
How analysts use foot traffic to value Wendy’s
The highest-value applications connect visit signals directly to valuation inputs. Prioritize these use cases:
- Weekly and monthly SSS estimation: Build a rolling model that updates as panel data refreshes. A sustained 5%+ visit decline at a cluster of locations is an early warning for a guidance miss.
- FreshAI initiative validation: Compare drive-thru throughput metrics at FreshAI-enabled locations versus non-enabled locations in similar trade areas. A measurable throughput lift supports the FreshAI investment case and provides a data point for modeling the system-wide rollout impact.
- Closure risk screening: Persistent visit declines at individual units, especially when combined with Buywendys’s Project Fresh closure tracker, can flag franchise locations at risk before a formal closure announcement.
- Franchisee performance benchmarking: Third-party data allows comparison across franchisee clusters without requiring access to individual operator financials.
- Capex and lease screening: Visit trends around proposed new-unit markets inform site-selection decisions and support or challenge management’s disclosed development pipeline.
Scenario example: An analyst detects a 10% sustained visit decline over six weeks at a cluster of Wendy’s locations in a single DMA. The next step is to test whether the drop is systemic (demand-driven, affecting all QSR in the area) or idiosyncratic (operational, affecting only Wendy’s). Cross-brand benchmarking via Placer.ai or Foursquare resolves this quickly. If peers are flat and only Wendy’s is down, the signal warrants a model revision and a closer look at franchisee disclosures.
Worked example: converting visitor counts into a same-store-sales estimate
A defensible SSS estimate requires a conversion anchor and a ticket-size assumption. The table below shows a simplified one-location example.
| Input | Prior Year | Current Year |
|---|---|---|
| Average order value (AOV) | $10.20 | — |
Step-by-step:
- Reduce raw visits by ~20% for deduplication (staff, repeat passes, drive-bys).
- Apply the conversion rate from your POS-anchored baseline.
- Multiply transactions by AOV to get estimated revenue.
- Divide current-year revenue by prior-year revenue and subtract 1 for SSS.
Sensitivity check: If AOV rises to $10.20 (a 7% increase), estimated revenue flips to $66,974, turning the SSS estimate positive at +2.0%. That swing illustrates why separating the visit-count effect from the ticket-size effect matters. Always run the model at three AOV assumptions (base, bear, bull) and validate the output against Wendy’s disclosed royalty per unit before presenting the estimate.
What can mislead your analysis
The most consequential errors in foot traffic analysis come from dataset biases that are invisible without deliberate validation.
- Panel representativeness: Mobile panels skew toward smartphone users with location services enabled. Lower-income or older demographics, which are meaningful segments of Wendy’s customer base, may be underrepresented.
- Staff and repeat-pass double-counting: Without dwell-time filtering and speed thresholds, employees and drive-by vehicles inflate raw counts significantly.
- Vehicle passby at drive-thrus: Drive-thrus generate high-speed passes that register as visits in poorly configured geofences. Ticon’s AADT and 15-minute interval data helps separate stoppable traffic from passby volume.
- Local events and temporary closures: A concert venue or sports event near a Wendy’s can spike visits with no revenue correlation. Always cross-reference anomalous spikes against local event calendars.
- Data latency: A vendor with a weekly update cycle cannot support near-term earnings signals. Confirm the actual refresh cadence, not the marketed one.
- Vendor accuracy overclaims: Sensor accuracy of 95–99% applies to audited installations. Unaudited deployments or mobile panels in low-density markets carry wider error bands.
Red-flag test: Sudden, asymmetric traffic changes across nearby stores in the same DMA almost always indicate panel noise or a local event rather than a genuine demand shift. Validate with POS data or an on-ground check before revising estimates.
What to ask a vendor before trusting their data
Insist on methodological transparency and POS validation before building any conversion-based revenue estimate on a vendor’s dataset.
- Panel or sensor sample size by DMA: What is the device count or sensor coverage for each market where Wendy’s operates?
- Geofence accuracy and update process: How are geofences defined, and how often are they reviewed for accuracy as store layouts change?
- Deduplication rules: How does the vendor identify and remove staff pings, repeat passes, and drive-by vehicles?
- Update cadence and latency: What is the actual data refresh frequency, and what is the lag between a real-world visit and its appearance in the dashboard?
- Device-OS coverage: What is the iOS-to-Android split, and how is demographic skew corrected?
- Historical time-series depth: How many years of comparable data are available for trend analysis?
- Vendor-stated accuracy and independent validation: Can the vendor provide an independent validation study, not just internal claims? Unacast, for example, publishes device-level validation with R-squared metrics from external studies.
- POS linkage capability: Can the vendor link visit data to transaction records for a 3–5 store validation sample before you commit to a full dataset purchase?
Key Takeaways
Foot traffic data is most valuable to Wendy’s investors when it is anchored to POS conversion, normalized for trade-area context, and validated against reported royalty figures before entering a valuation model.
| Point | Details |
|---|---|
| Use visits as a denominator | Divide transactions by deduplicated unique visits to isolate conversion rate from ticket-size effects in SSS analysis. |
| Validate conversion with POS | A 3–5 store POS linkage sample before scaling estimates prevents systematic error in revenue projections. |
| Control for FreshAI at drive-thrus | Throughput gains from FreshAI can mimic demand increases; separate rollout timing from organic visit growth. |
| Demand independent validation | Ask vendors for external R-squared or audit results, not just internal accuracy claims, before trusting panel data. |
| Buywendys as an analytical layer | Buywendys’s Project Fresh closure tracker and SSS-linked valuation reports provide a pre-built cross-reference for traffic-derived signals. |
How Buywendys integrates foot traffic into its Wendy’s analysis
Buywendys treats foot traffic signals as a leading indicator, not a standalone metric. The site’s workflow layers third-party visit data against Wendy’s disclosed royalty revenue, franchise-level disclosures, and on-ground verification to produce SSS estimates with an explicit conversion anchor. When visit signals diverge from royalty trends, the discrepancy becomes the analytical question, not the answer.
The Project Fresh closure tracker is the most direct application. By cross-referencing sustained visit declines at specific locations against Wendy’s disclosed closure activity, Buywendys can distinguish between demand-driven closures and strategic portfolio pruning. That distinction matters for modeling the system-wide unit count and its effect on royalty revenue.
Buywendys also applies trade-area context when interpreting traffic data, recognizing that a visit spike near a high-traffic retail corridor carries different conversion implications than the same spike in a standalone suburban location. The site’s valuation reports incorporate these distinctions explicitly, giving analysts a reproducible framework rather than a single-point estimate.
Buywendys gives analysts a structured starting point
Analysts who want to move from raw visit data to a model-ready SSS estimate face two practical problems: sourcing the right dataset and knowing which conversion assumptions are defensible for Wendy’s specifically. Buywendys addresses both.

The site’s fundamental analysis report integrates traffic-derived revenue assumptions with Wendy’s royalty economics, franchise disclosures, and margin benchmarks, giving analysts a single document that connects visit signals to valuation outputs. The Project Fresh closure tracker provides a verified, ongoing record of U.S. Wendy’s closures that serves as a ground-truth check against vendor-reported traffic declines. For analysts building a bull-bear scenario model, Buywendys’s stock scenario analysis shows how traffic and conversion assumptions alter the valuation range under different operating conditions.
Visit Buywendys.com to access the current fundamental report and closure tracker, or subscribe for model-ready updates as new traffic and royalty data becomes available.
Useful sources and further reading
The sources below are the most useful starting points for replicating or validating the methodology described in this article.
- RetailNext foot traffic analytics: Methodology documentation for sensor-based counting, including accuracy claims, deduplication approach, and 15-minute interval data delivery. Start here for sensor validation questions.
- Placer.ai foot traffic guide: Step-by-step overview of mobile panel collection methods, trade-area analysis, and cross-brand benchmarking. Useful for understanding panel construction and normalization.
- Placer.ai restaurant industry trends: Live dashboard showing year-over-year visit trends by state and chain. A quick benchmark for Wendy’s relative performance.
- Unacast foot traffic data: Device-level model documentation and validation performance metrics. Request the R-squared validation data when evaluating panel accuracy.
- Ticon C-Site restaurant analytics: AADT, hourly, and 15-minute interval traffic data for drive-thru stop-potential analysis. Relevant for Wendy’s given its drive-thru-heavy format.
- BlueOrbiting trade-area analysis guide: Practical framework for layering co-tenancy, drive times, and daypart splits onto raw visit counts.
- Buywendys Project Fresh closure tracker: Verified U.S. Wendy’s closure data for cross-referencing traffic-derived deterioration signals against confirmed operational outcomes.
- Buywendys fundamental analysis report: Model-ready valuation inputs that incorporate traffic-derived SSS assumptions alongside royalty and franchise economics.