
Wendy’s FreshAI deployment and the broader shift toward integrated back-of-house automation make AI margin-accretive for QSR operators in 2026, with AI adopters reporting 61% reduced food costs and 62% reduced labor costs in mid-year survey data, positioning Wendy’s for measurable unit-economics improvement as rollout scales.
Key signals for your model:
- FreshAI was deployed across 500+ Wendy’s locations by late 2025; the 2026 rollout curve and franchise adoption rate are the primary variables determining how quickly store-level savings convert to corporate royalty flows.
- The highest-ROI levers are demand forecasting (waste reduction), drive-thru voice automation, and direct-order channel recovery, each of which maps to a distinct P&L line: food cost, labor, and delivery-fee avoidance.
- Back-office AI adoption for reporting and analytics reached 69% among operators by mid-2026, widening the profitability gap between adopters and non-adopters.
Table of Contents
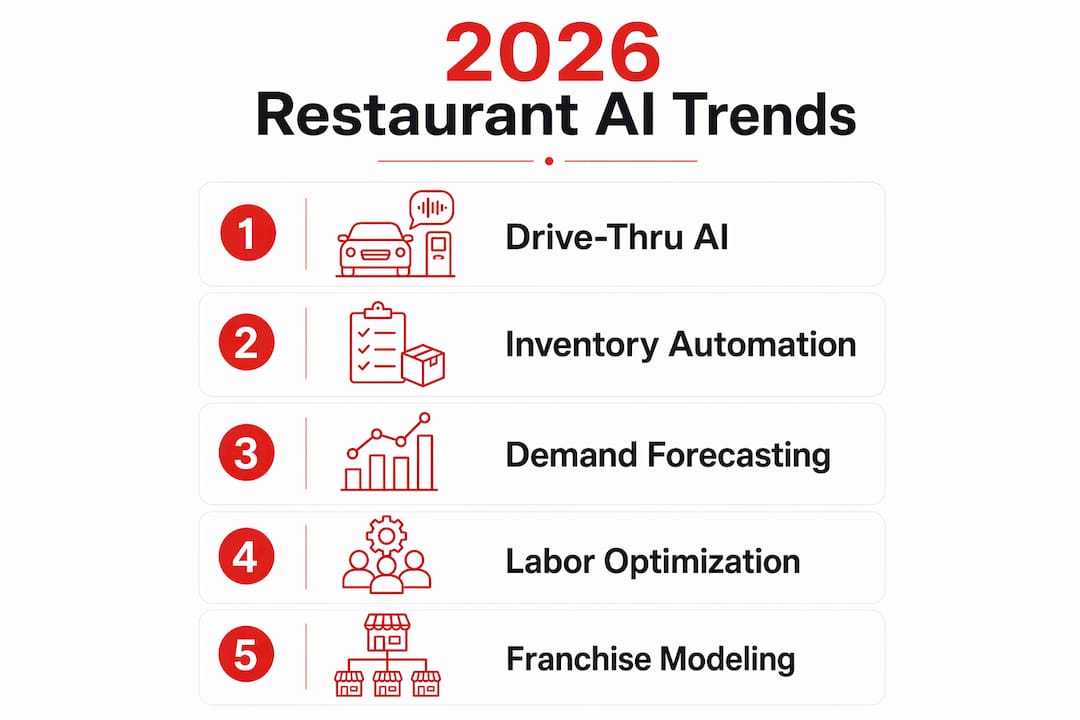
- What are the five restaurant AI trends in 2026 investors must track?
- Why do these 2026 AI trends matter specifically for Wendy’s?
- How do you model AI’s effect on Wendy’s unit economics?
- What risks should investors monitor when valuing AI initiatives?
- Which signals in Wendy’s filings and earnings calls matter most?
- What does the 2026 AI adoption timeline look like for operators?
- Key Takeaways
- The investor case for restaurant AI is stronger than the headlines suggest
- Buywendys tracks Wendy’s AI progress so your model stays current
- Primary sources and further reading
What are the five restaurant AI trends in 2026 investors must track?
The restaurant AI trends shaping 2026 are not about novelty. They are about margin, and each trend below connects directly to a P&L lever.
-
Connected operating models. The National Restaurant Association Show 2026 confirmed that the next phase of 2026 restaurant technology is integration: POS, payments, labor, inventory, and analytics working from a single data layer. Operators who consolidate onto one platform reduce reconciliation errors and gain real-time margin visibility. For Wendy’s, this means franchise-level data flowing into corporate reporting without manual intervention.
-
Back-of-house efficiency over guest-facing novelty. The 2026 Restaurant Technology Outlook Market Leader Report documents a clear shift toward back-of-house investment, with reporting/analytics, scheduling, and inventory forecasting leading adoption. Guest-facing AI generates press; forecasting and scheduling generate margin.
-
Voice ordering at scale. Drive-thru voice automation pays off in high-volume QSR contexts. Wendy’s FreshAI is the sector’s largest voice deployment, reaching 500+ locations through 2025. The ROI case depends on order volume per lane: high-volume locations amortize the software cost faster and show cleaner contribution-margin effects.
-
Direct-ordering channel recovery. Third-party delivery platforms extract 15%–30% of order value in commissions. Operators who migrate even a fraction of that volume to owned digital channels reclaim meaningful margin per transaction. a notable share of consumers now use AI tools to discover restaurants, and a large majority of operators believe connecting systems improves profitability, reinforcing the case for owned-channel investment.
-
Platform consolidation and governance. The 2026 Restaurant AI Stack white paper warns against assembling “seven silos and zero decisions.” Operators who buy disjointed tools without a governance layer end up with data that cannot be acted upon. The winning architecture builds across four layers: data capture, decision intelligence, execution, and governance. For investors, this means scrutinizing whether a chain’s tech spend is building a coherent stack or accumulating point solutions.
Why do these 2026 AI trends matter specifically for Wendy’s?
Wendy’s franchise model is the transmission mechanism. When a franchisee reduces food-cost variance by 200 basis points through demand forecasting, that improvement flows through to higher franchisee profitability, which supports royalty payment reliability and reduces franchisee distress risk. Corporate Wendy’s collects royalties as a percentage of systemwide sales, so any AI-driven AUV uplift, even modest, compounds across roughly 7,000 units.
FreshAI is the most visible lever. Wendy’s had scaled the drive-thru voice system to 500+ locations by late 2025, making it the largest deployment of its kind in the QSR sector. The financial case is straightforward at high-volume locations: voice automation reduces order-taking labor hours, improves order accuracy (reducing waste and comps), and can modestly increase average ticket through consistent upsell prompting. The rollout curve from 500 to a larger share of the system is the variable that determines when these benefits become material at the corporate P&L level.
Integrated POS and inventory automation reduce food-cost variance, which is one of the most volatile line items in QSR unit economics. Demand forecasting that cuts over-ordering by even a small percentage translates directly to food-cost percentage improvement. At scale across thousands of units, those basis points accumulate into meaningful EBITDA.
Pro Tip: When reviewing Wendy’s earnings disclosures, require three specific data points before crediting AI benefits in your model: (1) the percentage of drive-thru lanes with FreshAI active, (2) any disclosed food-cost variance delta attributable to forecasting tools, and (3) the franchise reimbursement policy for tech capex. Without all three, any AI-driven margin improvement is speculative.
How do you model AI’s effect on Wendy’s unit economics?
The modeling framework starts at the unit level and scales through the royalty structure. The primary levers are food-cost variance reduction, labor-hours saved, AUV uplift from direct ordering, and delivery-fee recovery per migrated transaction.
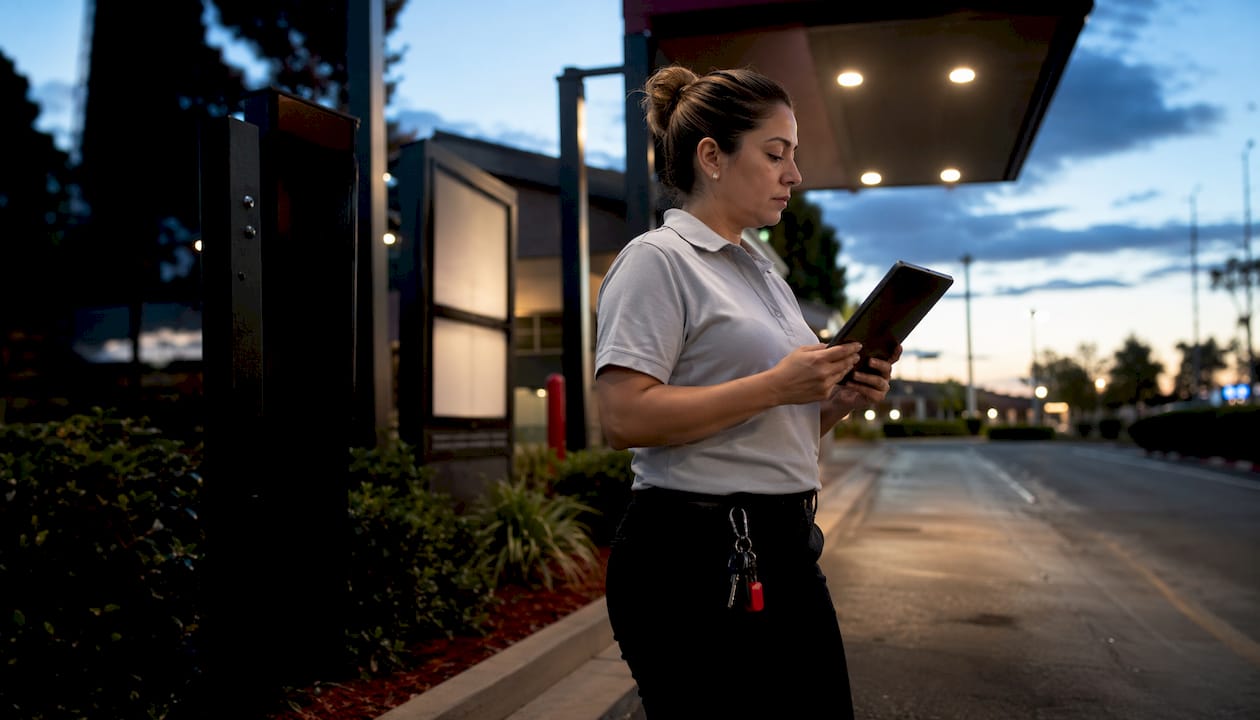
The sensitivity table below uses conservative, base, and aggressive rollout assumptions. AUV is assumed at approximately $1.7M per unit; royalty rate at approximately 4%–5% of systemwide sales; Wendy’s system at approximately 7,000 units with roughly 5%–6% company-owned.
| Scenario | Drive-Thru AI Coverage | Food Cost Reduction (bps) | Labor Savings (%) | Systemwide AUV Uplift | Estimated EBITDA Impact |
|---|---|---|---|---|---|
| Conservative | 10% of system | — | 1% | Minimal | Low single-digit $M |
| Base | 30% of system | 100 bps | 2%–3% | — | Mid single-digit $M |
| Aggressive | 60% of system | — | 4%–5% | — | High single-digit to low double-digit $M |
Assumptions: AUV ~$1.7M, royalty rate ~4.5%, franchise share ~94%, capex per deployment not publicly disclosed. Payback period modeled at 18–36 months depending on order volume.
The demand forecasting lever deserves particular weight. Industry data suggests that every dollar of food waste eliminated can generate multiples in recovered revenue, making forecasting the highest-priority deployment for operators focused on prime cost. For Wendy’s, this maps to food-cost percentage improvement that flows directly to franchise-level contribution margin and, through royalties, to corporate free cash flow.
Pro Tip: Model the rollout ramp in two phases: H1 2026 as proof-of-concept and measurement, H2 2026 as scaled deployment. Apply a 6–12 month lag between deployment and measurable P&L impact to avoid front-loading benefits. For free cash flow modeling, treat AI capex as a separate line with its own amortization schedule rather than folding it into general maintenance capex.
What risks should investors monitor when valuing AI initiatives?
AI spending becomes an earnings headwind when deployment outpaces governance. The specific risks to track:
- Franchisee adoption variability. Wendy’s cannot mandate technology adoption across its franchise system without navigating reimbursement and capex-sharing agreements. Slower-than-projected franchise uptake is the most likely scenario that causes base-case models to miss.
- Integration complexity and data silos. Buying point solutions without a unified data layer produces what the 2026 Restaurant AI Stack white paper calls “seven silos and zero decisions.” Fragmented tools generate data that cannot be acted upon in real time, negating the ROI case.
- Data security and governance costs. 32% of operators plan to invest in data management and security in 2026. For a system of Wendy’s scale, a data breach or regulatory exposure related to consumer ordering data could generate unexpected costs that offset technology savings.
- Overstated pilot results. Temporary ticket uplift from novelty (customers interacting with a new voice system) can look like sustainable margin improvement in short-window pilots. Require at least two full quarters of post-deployment data before crediting benefits.
- Customer experience trade-offs. Voice AI errors, long resolution times, or system outages at the drive-thru can damage throughput and guest satisfaction scores, creating a revenue headwind that offsets labor savings.
Which signals in Wendy’s filings and earnings calls matter most?
Track these specific disclosures and metrics across 10-Q/10-K filings and earnings call transcripts:
| Signal | Where to Find It | What to Watch For |
|---|---|---|
| FreshAI deployment % | Earnings call, investor presentations | % of drive-thru lanes active; quarterly change |
| Food-cost variance delta | 10-Q operating metrics | Basis-point change attributable to forecasting |
| Labor hours saved | Earnings call commentary | FTE equivalent savings per store per week |
| Direct-order share | Investor presentations | % of transactions through owned digital channels |
| Franchise tech capex policy | 10-K franchise disclosures | Reimbursement structure, required vs. optional |
| Payback period disclosure | Earnings Q&A | Management’s stated ROI timeline for AI capex |
Sample earnings-call questions worth asking management: “What percentage of system drive-thru lanes are currently running FreshAI, and what is the measured order-accuracy improvement versus baseline?” and “How does the franchise agreement address technology capex reimbursement, and what adoption rate are you modeling for 2026?”
What does the 2026 AI adoption timeline look like for operators?
The phasing matters for modeling. Operators are not deploying everything at once, and the investment priority sequence follows a clear back-to-front logic.
- Q1–Q2 2026: Proof-of-concept and measurement. Operators finalize vendor selection, run controlled pilots, and establish baseline KPIs. Back-of-house tools (forecasting, scheduling, inventory) go live first because they carry lower integration risk and faster payback.
- Q3 2026: Scaled back-of-house rollout. Reporting/analytics and demand forecasting reach broad adoption. The 69% adoption rate for back-office AI among operators by mid-2026 confirms this phase is already underway.
- Q4 2026: Front-of-house and voice automation expansion. High-volume operators scale voice ordering where unit economics justify the capex. Governance and data-security infrastructure investment accelerates alongside, given that 32% of operators have flagged this as a 2026 priority.
For scenario modeling: a conservative assumption places 10% of Wendy’s system on integrated AI tools by year-end 2026; a base case reaches 30%–40% within 24 months; an aggressive case assumes 60%+ coverage if franchise adoption incentives are structured favorably. The 2026–2028 forecast model at Buywendys incorporates these phasing assumptions.
Key Takeaways
AI adoption in 2026 is margin-accretive for Wendy’s when FreshAI rollout scales and back-of-house forecasting reduces food-cost variance, but the corporate P&L impact depends entirely on franchise adoption rate and integration quality.
| Point | Details |
|---|---|
| FreshAI rollout pace is the key variable | 500+ locations active by late 2025; franchise adoption rate determines when savings reach corporate royalty flows. |
| Back-of-house ROI comes first | Demand forecasting and scheduling deliver faster payback than guest-facing AI; model these as the primary 2026 levers. |
| Adoption gap is widening | AI adopters reported 61% reduced food costs and 62% reduced labor costs in mid-2026 survey data, creating a measurable profitability gap. |
| Monitor three disclosure signals | Track FreshAI deployment %, food-cost variance delta, and franchise capex reimbursement policy in every filing. |
| Buywendys for ongoing modeling | Buywendys provides scenario analysis, unit-economics breakdowns, and FreshAI rollout tracking for investors building WEN models. |
The investor case for restaurant AI is stronger than the headlines suggest
The conventional framing of restaurant AI focuses on the customer experience: voice ordering, personalized menus, AI-generated recommendations. That framing misses where the actual money is. The most durable margin improvements in 2026 come from back-of-house automation that most investors never see: demand forecasting that reduces over-ordering, scheduling tools that match labor to traffic patterns, and integrated data layers that let operators act on real-time P&L signals rather than weekly reports.
For Wendy’s specifically, the franchise model creates a leverage dynamic that amplifies both the upside and the risk. A 100-basis-point improvement in food-cost percentage across thousands of franchise units does not show up directly on Wendy’s corporate income statement, but it does show up in franchisee health, royalty payment reliability, and the company’s ability to grow the system without distress. Investors who model only the direct corporate cost savings are underweighting the systemic benefit.
The honest caveat: the data on AI ROI in QSR is still maturing. Survey-based figures on cost reductions reflect self-reported operator data, and the gap between pilot results and system-wide performance is real. Weight AI-driven margin improvements at a discount to traditional operational improvements until Wendy’s management provides two or more quarters of auditable, deployment-linked data. That is the disciplined approach, and it is the one Buywendys applies in its ongoing WEN coverage.
Buywendys tracks Wendy’s AI progress so your model stays current
Investors who want to monitor FreshAI deployment metrics, unit-economics changes, and franchise adoption rates without rebuilding their analysis from scratch after every earnings cycle will find Buywendys’s research pages directly useful. The platform covers FreshAI’s investor implications in depth, including the drive-thru revenue impact model and franchise margin analysis that underpin the sensitivity scenarios in this article.
Buywendys also publishes regular updates on WEN stock events, valuation signals, and AI-driven revenue impact analysis that translate operational disclosures into model-ready inputs. For investors who want to run their own scenarios, the Wendy’s stock valuation model provides a structured framework with adjustable assumptions for rollout pace, royalty rates, and capex amortization. Start there to stress-test your current WEN position against the AI adoption scenarios outlined above.
Primary sources and further reading
- National Restaurant Association Show 2026: Conference observations used to establish the industry consensus on integrated operating models and the direction of 2026 restaurant technology investment.
- Diego F. Parra, Restaurant AI Stack 2026 (Masterestaurant): White paper providing the four-layer architecture framework and the “seven silos” governance warning; used for trend analysis and risk identification.
- 2026 Restaurant Technology Outlook Market Leader Report (Nation’s Restaurant News): Source for the back-of-house investment shift and the 32% data-management investment figure; used in trends summary and adoption timeline.
- Restaurant365 2026 Mid-Year Report: Survey of 420+ operators providing the 61%/62% food and labor cost reduction figures and the 69% back-office adoption rate; primary statistical source for the BLUF and modeling section.
- Masterestaurant AI Adoption Index 2026: Source for FreshAI deployment scale (500+ locations) and demand-forecasting ROI rationale; used in the Wendy’s-specific analysis and financial modeling section.
- SevenRooms 2026 Restaurant Industry Trends Report: Source for consumer AI discovery behavior (22%) and operator profitability belief (83%); used in the direct-ordering trend discussion.
- Buywendys FreshAI and WEN Stock Analysis: Buywendys’s own deep-dive on FreshAI economics and the investor case for WEN; used as the primary reference for franchise transmission mechanism analysis.